Hi,
I posted a smilar post where I wanted help with a Dynamic Age Banding issue, which looks like it is now fixed.
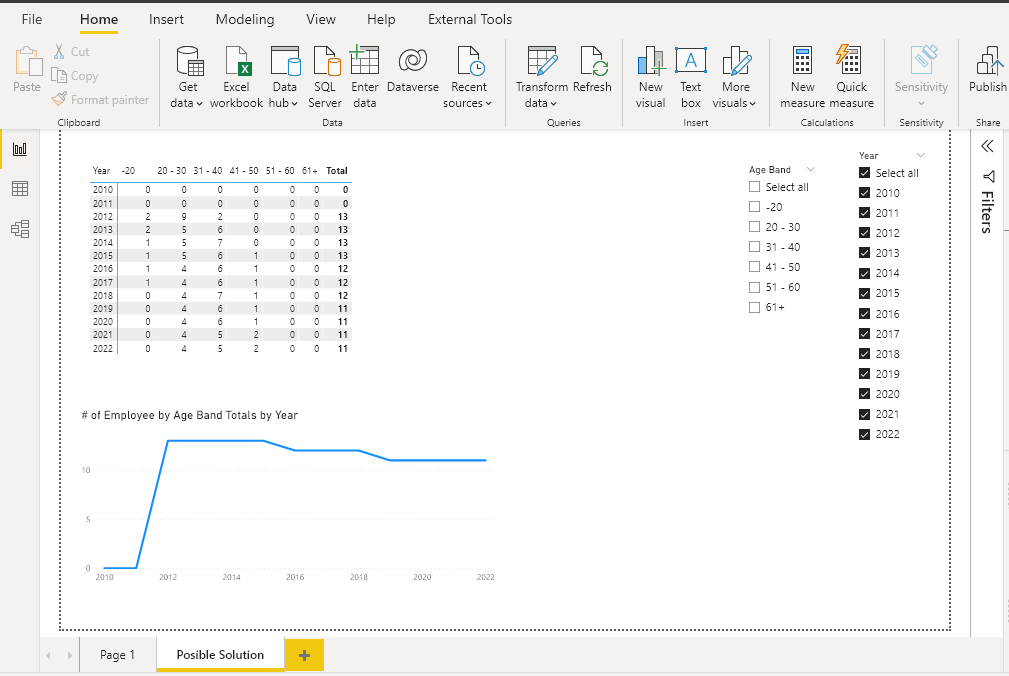
The attached pbix file has a visual Clustered column chart (Headcount by Age Band) where I want to show the Headcount for each Age Band, this will also change results when the Years have been changed, but the Headcount is showing the same value of 11 for each Age Band.
Why is it not showing the what the headcount is for each Age band category?
Any ideas?
Thanks
Dynamic Calculate Age and Headcount.pbix (180.9 KB)
1 Like
Hi @denwo1982
Thank you very much for posting your query in the forum.
I have created the following measure to calculate the Number of Employees for each age range:
# of Employee by Age Band_JAFP =

VAR _CurrentAgeBand = MAX( 'Age Band Desc'[Age Band] )

VAR _EmployeeandAgeRange = ADDCOLUMNS(

    VALUES( Employee[Employment Id] ),

        "@Age Range", [Age Range_JAFP]

)

VAR _Result = COUNTROWS(

    FILTER(

        _EmployeeandAgeRange,

        [@Age Range] = _CurrentAgeBand

    )

)

RETURN

_Result


Age Range_JAFP =

VAR _Age = [Age]

VAR _Result = CALCULATE(

    VALUES( 'Age Band Desc'[Age Band] ),

        FILTER(

          'Age Band Desc',

          'Age Band Desc'[Start] <= _Age &&

         'Age Band Desc'[End] >= _Age

        )

)

RETURN

_Result
Regards,
Dynamic Calculate Age and Headcount_JAFP.pbix (190.9 KB)
Hi @jafernandezpuga
Thanks for your reply, I’ve had a look at your latest report but it is not returning the correct results I am expecting to see for the Headcount and what it is for that Age Band for that time of Year.
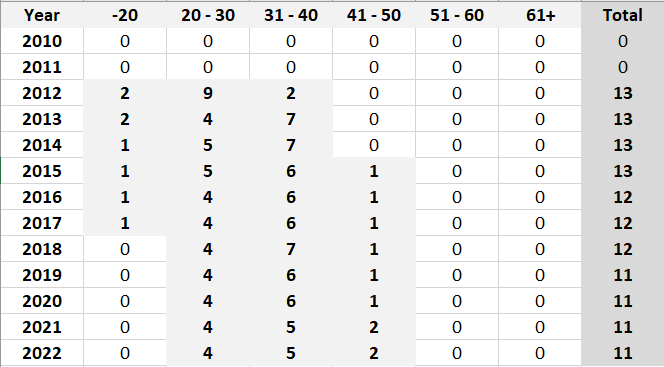
If you look at the below image that is what the headcount should be for each age band and for the year it is in
So for the Year 2022
I was expecting to see the below counts
“20 - 30” = 4
“31 - 40” = 5
“41 - 50” = 2
and all the other age bandings would be zero
But on yours it is showing…
“20 - 30” = 5
“31 - 40” = 7
“41 - 50” = 2
It looks like it is including in the Headcount the Employees that have Left (Employment End Date)
Thanks
1 Like
Hi @denwo1982 ,
I share a possible solution that I have been working on. I hope it can be of help to you.
Measures:
Age Range by Employee =

VAR _Employees =

CALCULATETABLE(

    VALUES( Employee[Employment Id] ),

      'Employee'[Employment Start Date] <= MAX( 'Calendar'[Date] ) &&

      (

            ISBLANK( 'Employee'[Employment End Date] ) ||

          'Employee'[Employment End Date] > MAX( Calendar[Date] )

        )

)

VAR _CurrentEmployee = MAX( Employee[Employment Id] )

VAR _Age = [Age]

VAR _Result = CALCULATE(

    VALUES( 'Age Band Desc'[Age Band] ),

        FILTER(

          'Age Band Desc',

          'Age Band Desc'[Start] <= _Age &&

         'Age Band Desc'[End] >= _Age

        )

)

RETURN

IF(

    _CurrentEmployee IN _Employees,

    _Result,

    BLANK()

)


# of Employee by Age Band Totals =

VAR _CurrentAgeBand = MAX( 'Age Band Desc'[Age Band] )

VAR _CurrentYear = MAX( 'Calendar'[Date].[Year] )

VAR _Employees = CALCULATETABLE(

    VALUES( Employee[Employment Id] ),

      'Employee'[Employment Start Date] <= MAX( 'Calendar'[Date] ) &&

      (

            ISBLANK( 'Employee'[Employment End Date] ) ||

          'Employee'[Employment End Date] > MAX( Calendar[Date] )

        )

)

VAR _EmployeesandAgeRange = FILTER(

    ADDCOLUMNS(

        CROSSJOIN(

            _Employees,

            VALUES( 'Calendar'[Date].[Year] )

        ),

        "@Age Range", [Age Range by Employee]

    ),

    NOT ISBLANK( [@Age Range] )

)

VAR _Result = SWITCH(

    TRUE(),

    ISINSCOPE( 'Age Band Desc'[Age Band] ) &&

    ISINSCOPE( 'Calendar'[Date].[Year] ),

    COUNTROWS(

        FILTER(

            _EmployeesandAgeRange,

            [@Age Range] = _CurrentAgeBand &&

          'Calendar'[Date].[Year] = _CurrentYear

        )

    ),

    NOT ISINSCOPE( 'Age Band Desc'[Age Band] ) &&

    ISINSCOPE( 'Calendar'[Date].[Year] ),

    COUNTROWS(

        FILTER(

            _EmployeesandAgeRange,

          'Calendar'[Date].[Year] = _CurrentYear

        )

    ),

    ISINSCOPE( 'Age Band Desc'[Age Band] ) &&

    NOT ISINSCOPE( 'Calendar'[Date].[Year] ),

    COUNTROWS(

        FILTER(

            _EmployeesandAgeRange,

            [@Age Range] = _CurrentAgeBand

        )

    )

)

RETURN

_Result + 0
Regards
Dynamic Calculate Age and Headcount_JAFP.pbix (177.3 KB)
Thanks @jafernandezpuga yes that looks good now, nice work! Excellent!
1 Like
Hi @jafernandezpuga how would I be able to drill through to the detail of the Employees that belong to that Age Band? Or is it not possible because it uses a Dynamic Segregation?
Would I have to redesign my model?
Hi @denwo1982,
We can create a Tooltip and in the Age by Employment graph, add the filter Age Range by Employee in not blank.
Regards,
Dynamic Calculate Age and Headcount_JAFP.pbix (176.8 KB)
1 Like