I’m looking to create a measure that ranks locations based on a series of filters. The rank is based on market share within the filter context. Ideally, I’d like to have top 3 with their percentage and the rest be categorized within an OTHER category. Has anyone completed this before and have an example of how they did it? My filters are National, State, and County.
Thanks Brian,
I have followed that for the filter process but, my shortfall is showing the top 3 clinics and merging the remainder into an OTHER category. Was thinking of using a reference table, but that takes away the clinic name for the top three…
Interesting problem. Would you be able to mask your clinic names and post your PBIX file? My initial thought would be to do this dynamically in DAX by creating virtual table A comprised of the ALLSELECTED records, a second virtual table B, which is TOPN(3) of A, and then rolling up the anti join of A and B (using EXCEPT) to create the total Other category. However, it would really help to be able to see your data, data model, current measures, etc. to better help work through a solution.
I’m also looping @Nick_M and @JarrettM in here, because I recall one of them responding to recent post about a similar Other category rollup, although I can’t seem to locate that via the forum search.
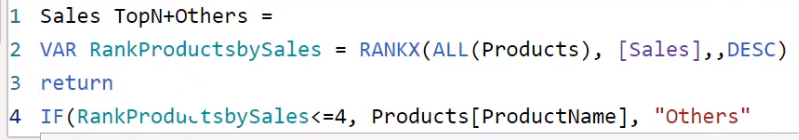
I thought Ruth’s solution in the video was incredibly simple and elegant – solves the whole problem with four simple lines of DAX code in a calculated column.
@BrianJ
Nice find! I just quickly looked at it, but it seems like since the “others” group is always going to have the biggest value, it is always on top. Think most would prefer to see it at the bottom. Then maybe instead of seeing the grand total of “others” might want to see what the average of the remain is, or the median, or whatever. So while i think the four line fix is awesome, it’s very limited in my view. Now, if that is the requirement then you are golden. I just think with a little more thought and slightly more complexity, you can make this measure do a lot.
Thank you for this! It is very helpful, but not a fit for my current need as you have to rank all locations first in a calculated column. this takes away the dynamic component to the chart I’m trying to achieve. Ruth’s solution, in my instance, would rank all clinics at the national level and could put some of my top clinics in a particular county, into the OTHER category. I’ve contemplated a number of calculated columns to get this result, but none seem to achieve what I need. I’m thinking I need to stay 100% in DAX and somehow have a virtual table as a Variable, but am unsure how to get all sub ranked locations into an OTHER category there.
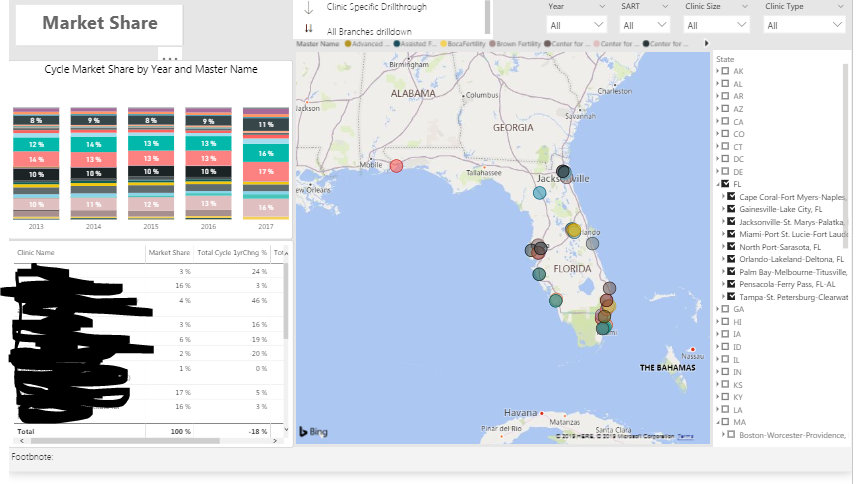
the work I’m doing is all from CDC data, which is publicly available, so I un-branded the pbix file and attached the onedrive link (file is too large for here)
FULL DISCLOSURE- This was a project I picked up from a former DAX writer and not all the measures are as clean as I’d like them, lol, so please don’t judge me on those! Phase 2 of this build is to tear many of those measures down and rewrite them in DAX studio to increase speed and efficiency.
OK, thanks very much for the clarification. I’ve got some ideas on how to do this, but want to really dig into the data tonight and try some different things. However, when I try to download, I get the following message:
Thus, can you please loosen the permissions on the file to allow me access, or filter the number of records in the file down sufficiently to allow you to upload directly via the forum?
This is a deceptively difficult problem. After working on it all weekend, I am finally forced to admit defeat. I was able to get the DAX working dynamically pretty quickly:
The nut I can’t crack though is aggregating market share based on the clinic grouping highlighted in red. I had the same thought you did about doing this in a virtual table. Replicated the table above virtually, and then figured it would be pretty simple to do a SumX on market share, grouping by Rank 1/2/3/Others. The unexpected problem was that DAX really limits your ability to call columns from virtual tables in this way.
So, then I tried materializing the table physically using the DAX code from the virtual table. This gives you more flexibility in calling columns into functions, but isn’t dynamic in the way you need with regard to the RankX ordering.
I’ve posted my PBIX with all the measures and approaches I’ve tried, with a dramatically simplified version of your data model. Hopefully, this moves the ball down the field at least a bit, and you or someone else on the forum can figure out how to carry it into the end zone.
I can’t thank you enough for your efforts. I reached out to Marco Russo too just to make sure that I covered all my bases and he literally just emailed me as well with this article that he just published today:
This is a good solution for a matrix, but I’m struggling with seeing how I can use this in the stacked graph. I’m going to be playing around with this method to see what I can come up with.
In the meantime, if anyone has another solution, I’d love to hear what they came up with!
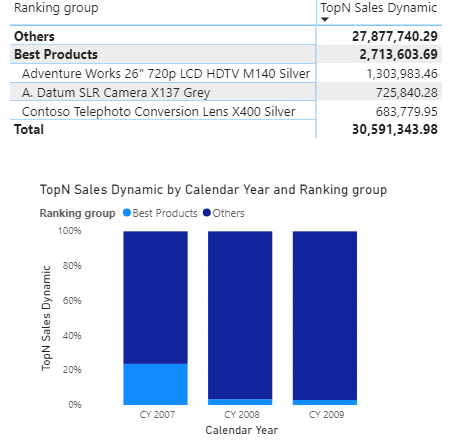
I downloaded the PBIX from his article, and his measure works perfectly in a stacked column chart (of course):
However, it also made me feel better about not being able to crack this nut, since this is some 5th degree black belt DAX (not to mention the multiple measures needed to stitch the matrix together):
TopN Sales Dynamic =
IF (
    ISINSCOPE ( 'Product Ranking'[Ranking group] ),  -- Show a value only if the Ranking Group is filtered
    VAR NumOfProducts = [Top Products Value]
    VAR RankingGroup =
        SELECTEDVALUE ( 'Product Ranking'[Ranking group] )
    VAR TopProducts =
        TOPN ( NumOfProducts, ALLSELECTED ( 'Product Ranking' ), [Sales Amount] )
    RETURN
        SWITCH (
            RankingGroup,
            "Best Products",
                CALCULATE ( [Sales Amount], KEEPFILTERS ( TopProducts ) ),
            "Others",
                IF (
                    NOT ISINSCOPE ( 'Product Ranking'[Ranking Name] ),
                    VAR TopAmount =
                        CALCULATE ( [Sales Amount], TopProducts )
                    VAR AllAmount =
                        CALCULATE ( [Sales Amount], ALLSELECTED ( 'Product Ranking' ) )
                    VAR OthersAmt = AllAmount - TopAmount
                    RETURN
                        OthersAmt
                )
        ),
    [Sales Amount]
)
Thanks for the article, and good luck on the rest of the project. Enjoyed working with you on this.