Dynamic Grouping returning error

Hi team, I am creating a dynamic group based on cost change. I want to have a cost decrease, cost maintained, and cost increase and return the value in a table. If the cost change is negative then cost decrease, if it’s equal to 0 - cost maintained and if it’s positive - cost increase.
I used this dynamic grouping formula.

I created the group with min and max values.
-100 to 0 for cost decrease
0 to 0 for cost maintained
0-1000 for cost increase

then used this formula

Cost by Group =
VAR _costRankingDimension = VALUES( ‘Sales Data’[SKU ID] )

RETURN
CALCULATE ([Cost Change],
FILTER( _costRankingDimension,
COUNTROWS(
FILTER(
‘Cost Grouping’,
[Cost Change] >= ‘Cost Grouping’[Min]
&& [Cost Change] <= ‘Cost Grouping’[Max] ) ) > 0 ))

The problem I have is the table doesn’t return it right with respect to the group. Please help. Thank you.

Hi @zeekstuarts, we aim to consistently improve the topics being posted on the forum to help you in getting a strong solution faster. While waiting for a response, here are some tips so you can get the most out of the forum and other Enterprise DNA resources.

  • Use the forum search to discover if your query has been asked before by another member.
  • When posting a topic with formula make sure that it is correctly formatted to preformatted text </>.image
  • Use the proper category that best describes your topic
  • Provide as much context to a question as possible.
  • Include the masked demo pbix file, images of the entire scenario you are dealing with, screenshot of the data model, details of how you want to visualize a result, and any other supporting links and details.

I also suggest that you check the forum guideline How To Use The Enterprise DNA Support Forum. Not adhering to it may sometimes cause delay in getting an answer.

Please also check the How To Mask Sensitive Data thread for some tips on how to mask your pbix file.

Hi @zeekstuarts , we’ve noticed that no response has been received from you since the 22nd of December. We just want to check if you still need further help with this post? In case there won’t be any activity on it in the next few days, we’ll be tagging this post as Solved. If you have a follow question or concern related to this topic, please remove the Solution tag first by clicking the three dots beside Reply and then untick the checkbox. Thanks!

@zeekstuarts

You are using >= and <=

If [Cost Change] = 0 it counts in all Groups.

Change the Grouping as below and try >= and <

-100 to 0 for cost decrease
0 to 1 for cost maintained
1-1001 for cost increase

[Cost Change] >= ‘Cost Grouping’[Min]
&& [Cost Change] < ‘Cost Grouping’[Max]

Thanks for the reply. It’s still not responsive.

Hi @zeekstuarts. Please post your work-in-progress PBIX file and an Excel mockup of your desired outcome for the forum members to investigate the issue further.
Greg

SalesDataSource.xlsx (160.8 KB) Dynamic Group.pbix (226.0 KB)

Hi guys, I just attached the .PBIX and the Excel Mockup files. Thank you.

Hello @zeekstuarts,

Thank You for posting your query onto the Forum.

Well the problem is with the data. When I analyzed the data into the Power Query I came to know where the problem has actually occurred and why the results were errorneous.

Let’s go through the step-by-step to understand where the problem actually was and why we’re not getting the results as expected.

Step 1: Errorneous/Ambiguous Results In Table Visual

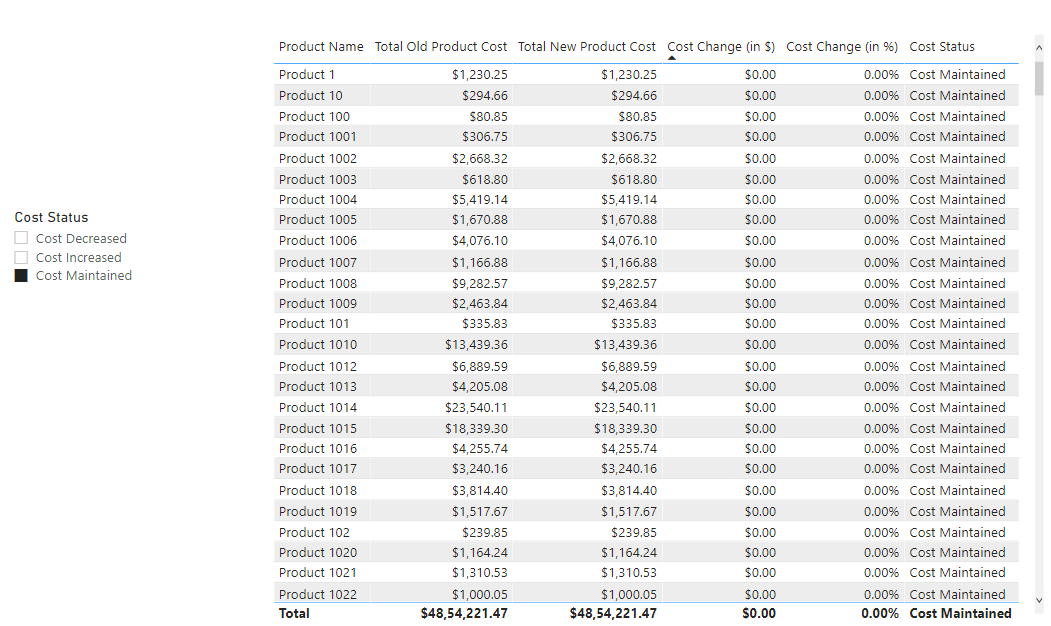
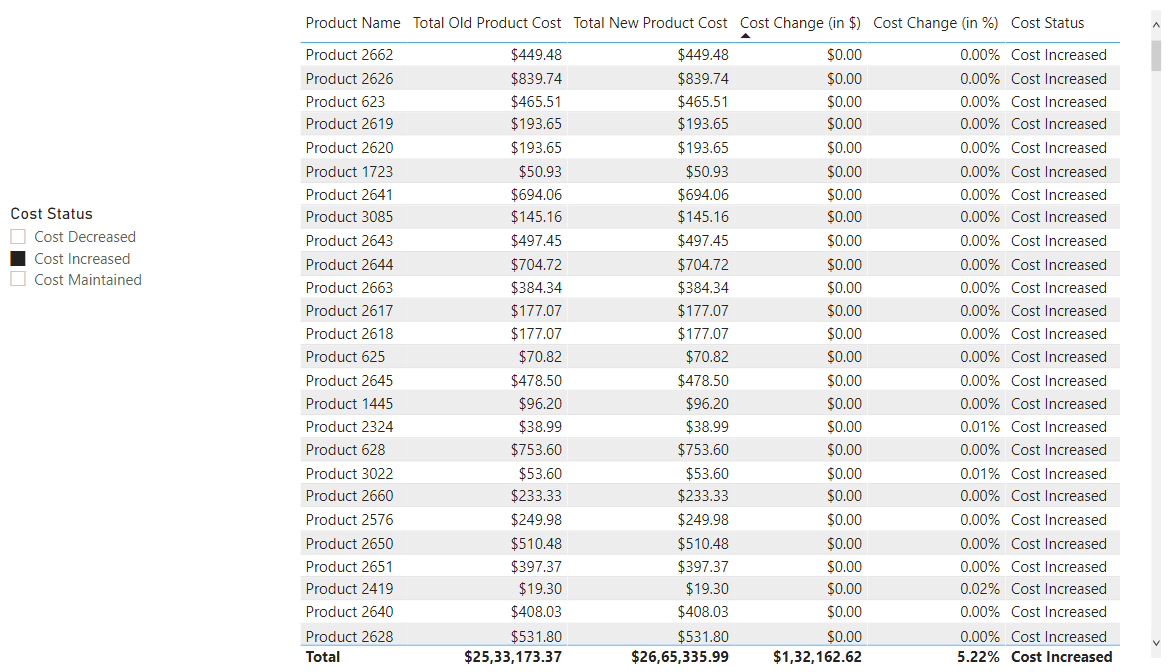
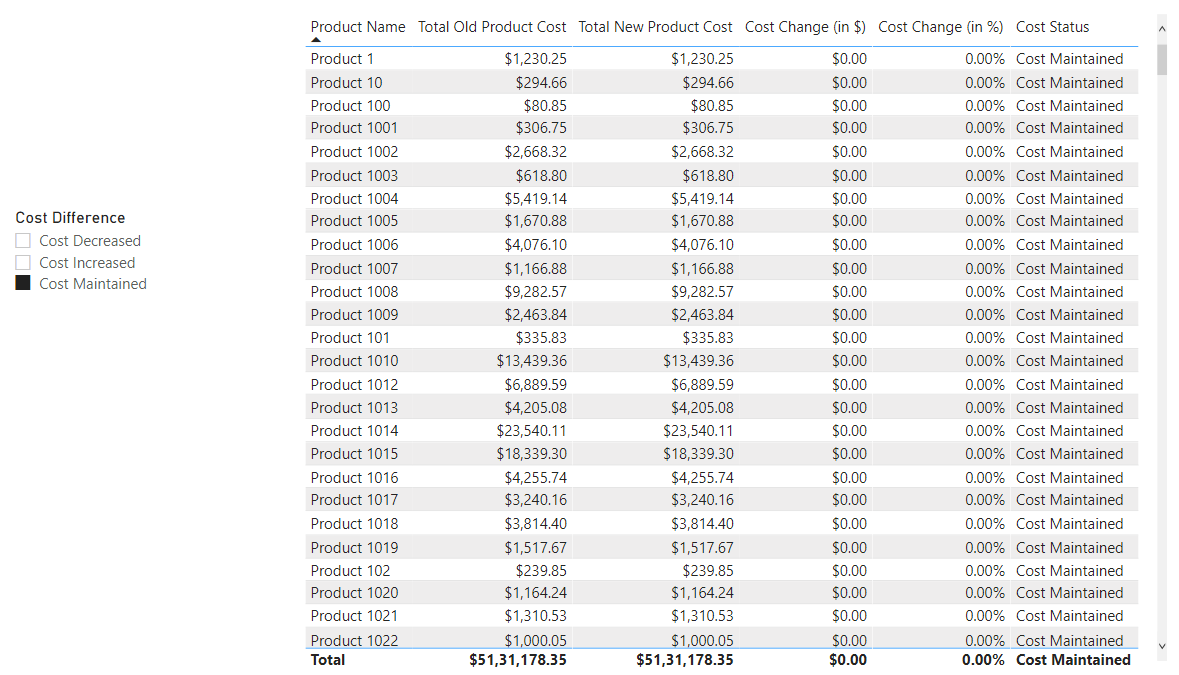
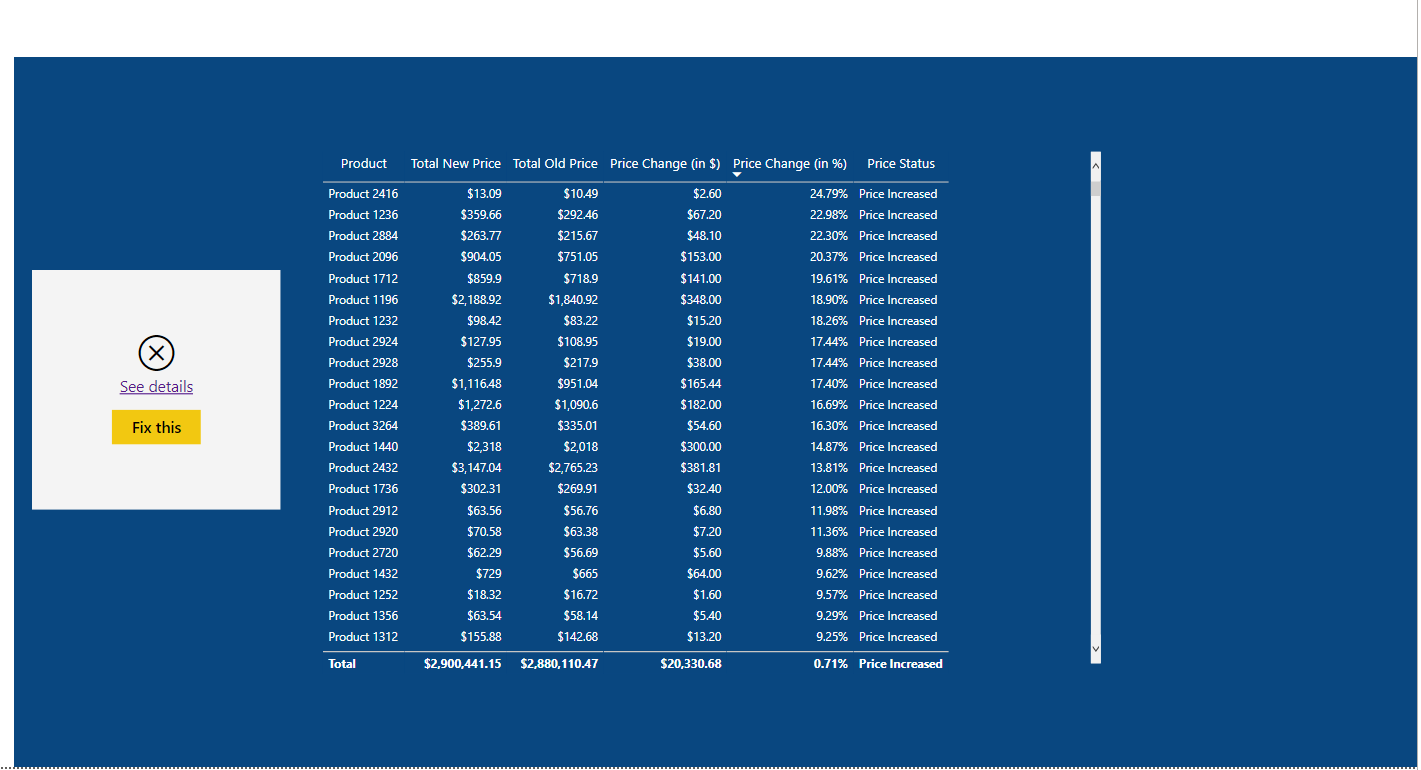
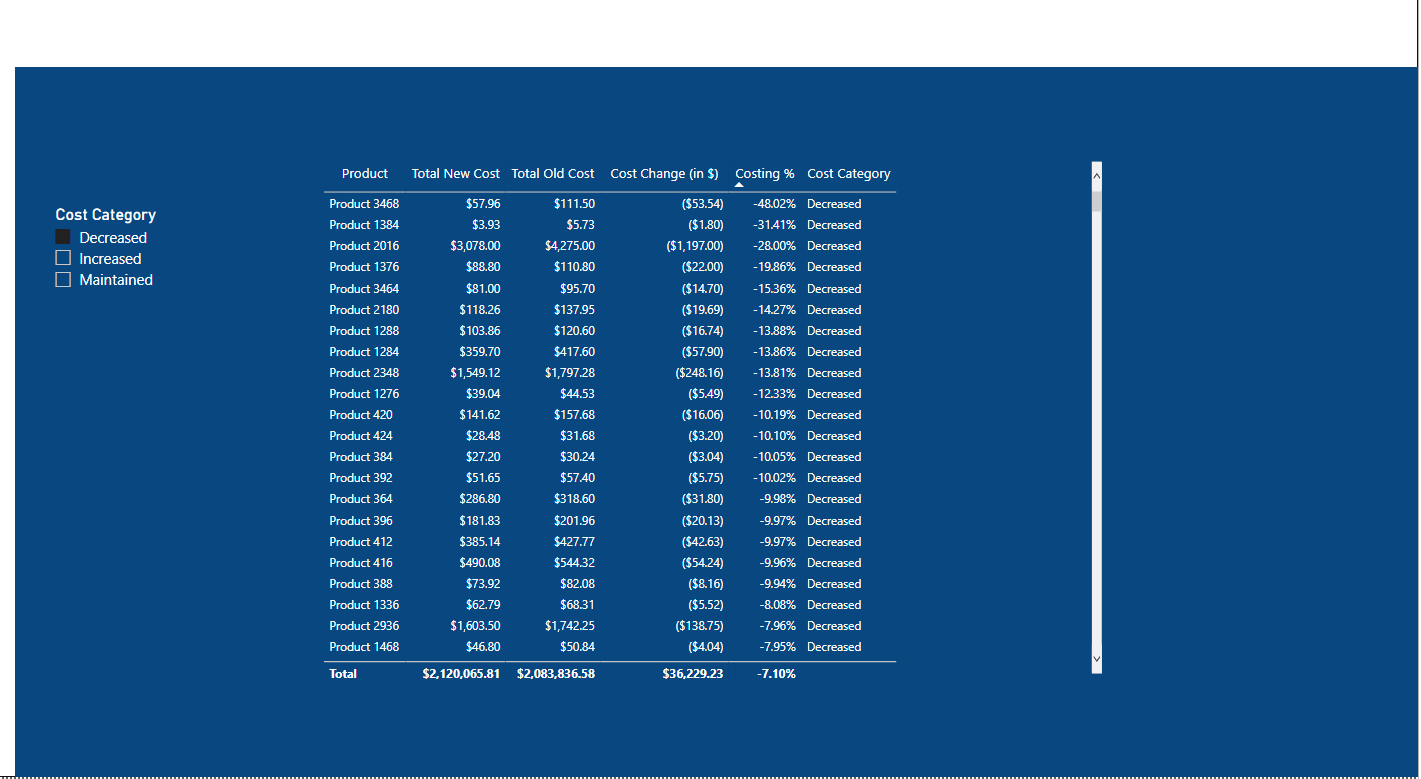
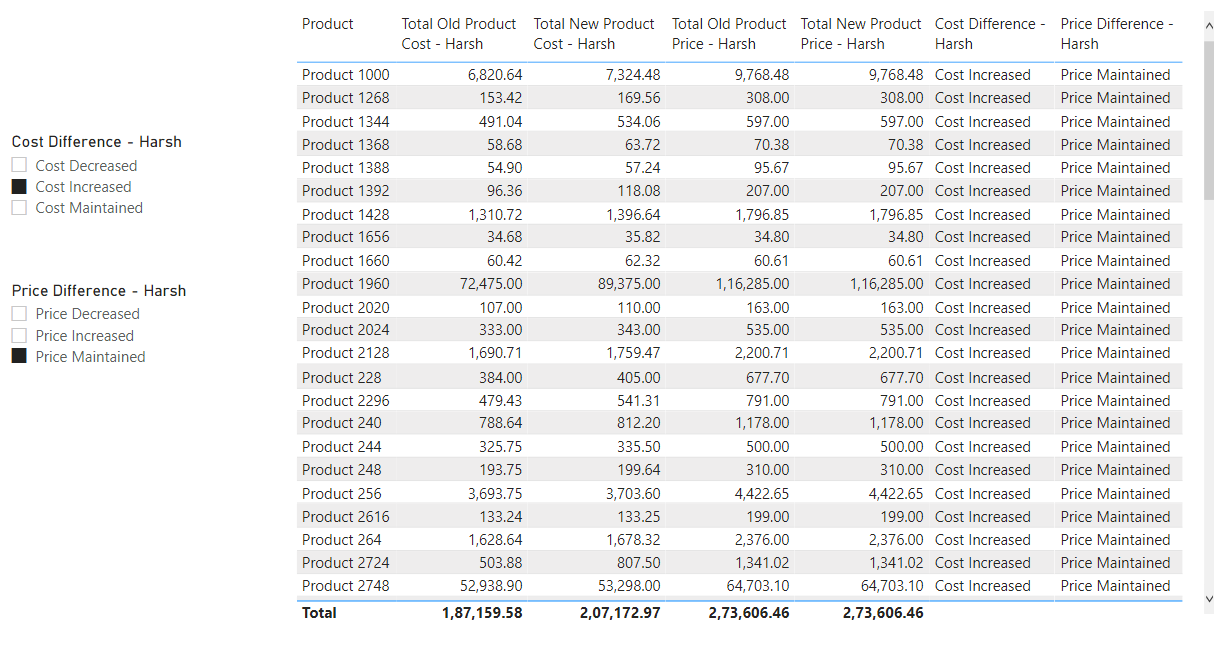
In the provided screenshots below, you’ll observe that although “Cost Maintained” results are correct but “Cost Increased and Cost Decreased” results are errorneous inspite of “Cost Change (in $) = 0”.

So after observing this incorrect results where did the error lie? And the answer is - In the Data itself and not in the formulas.

Step 2: Go back to the Power Query

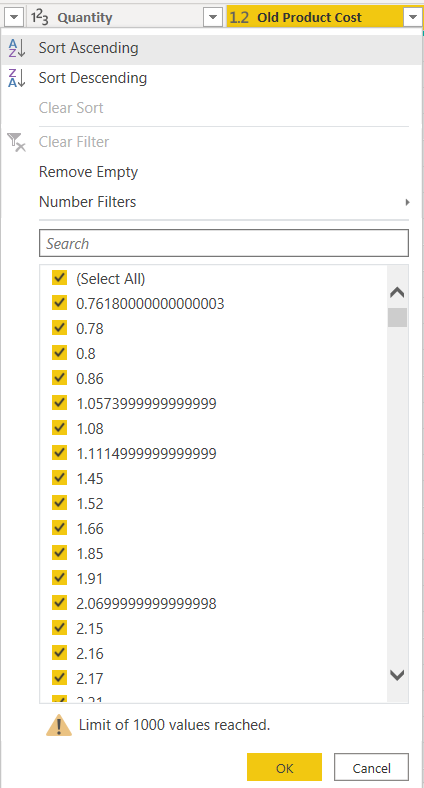
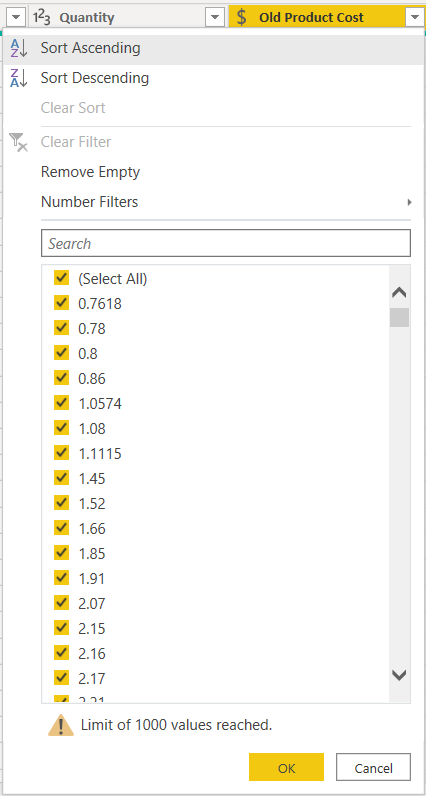
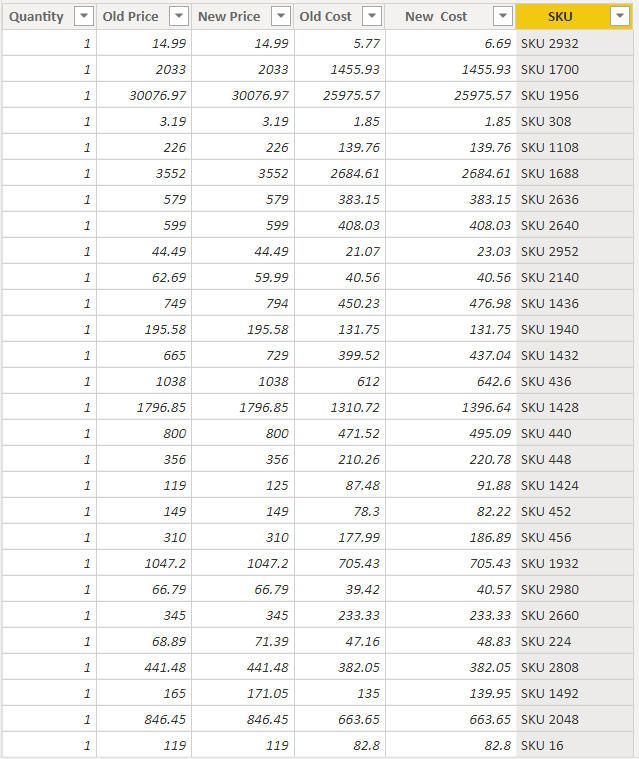
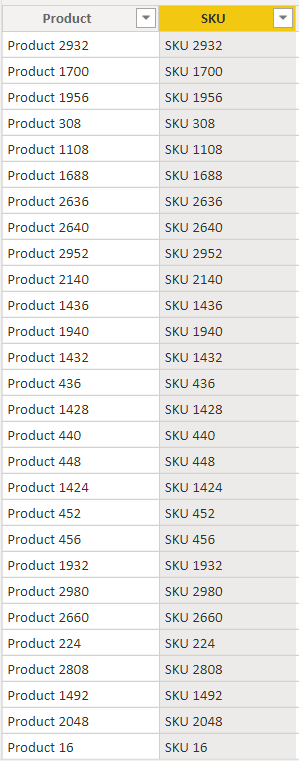
Now, the data type for columns Old Product Cost and New Product Cost is by default selected as “Decimal Number”. So when we click onto the filter drop-down option of both the columns. The numbers/data actually looks like this. Below is the screenshot provided for the reference -

Now, after observing the above screenshots you must be thinking that let’s change the data type of these two columns from “Decimal Number” to “Fixed Decimal Number”. Let’s try this and see how it looks in the next step.

Step 3: Change the data type of Old Product Cost and New Product Cost from “Decimal Type” to “Fixed Decimal Number”.

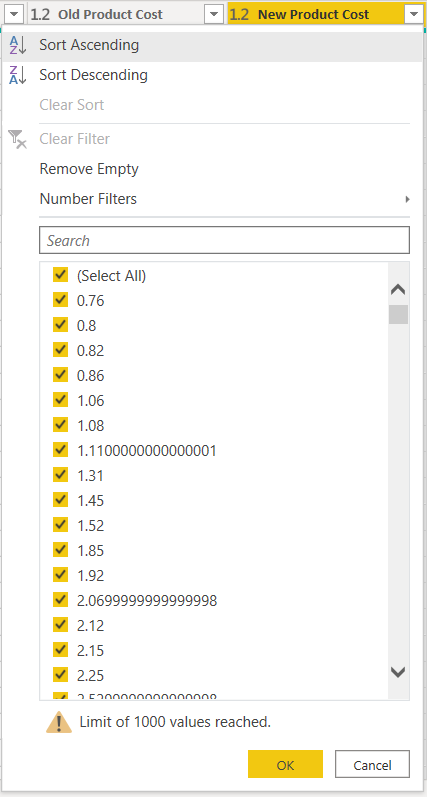
Now, since we have changed the data type from “Decimal Number” to “Fixed Decimal Number”. Let’s check whether the numbers are reduced to fixed number of decimal places or not. Below are the screenshots provided for the reference -

So now, you’ll observe that although the numbers have been reduced from recurring to a fixed decimal number but still there’s a problem. And that is, the decimal places under the Old Product Cost have been reduced either upto 3 or 4 places whereas for the New Product Cost the same have been reduced upto 1 or 2 places. So still there’s an “inconsistency” between the both the columns in terms of decimal places which will again provide the errorneous/ambiguous results. Let’s see what can be the concrete solution in the next step.

Step 4: Round the numbers upto 2 Decimal Places.

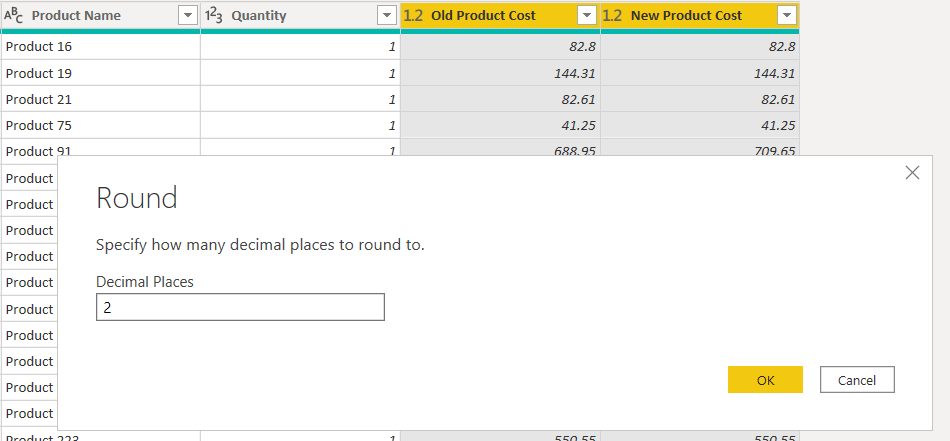
Rather than converting the data type from “Decimal Numbers” to “Fixed Decimal Numbers”. Round the numbers upto the two decimal places. Below is the screenshot provided about how to do it.

Select both the columns i.e. Old Product Cost and New Product Cost and go the “Transform” tab under the Power Query.

Under that from the “Number Column” menu click on the “Rounding” option and select the “Round…” option from the drop-down list and mention the decimal places option as 2. Here the screenshot -

Click on the “Close and Apply” option in order to check the final results of the “Table Visual

Step 5: Final Results.

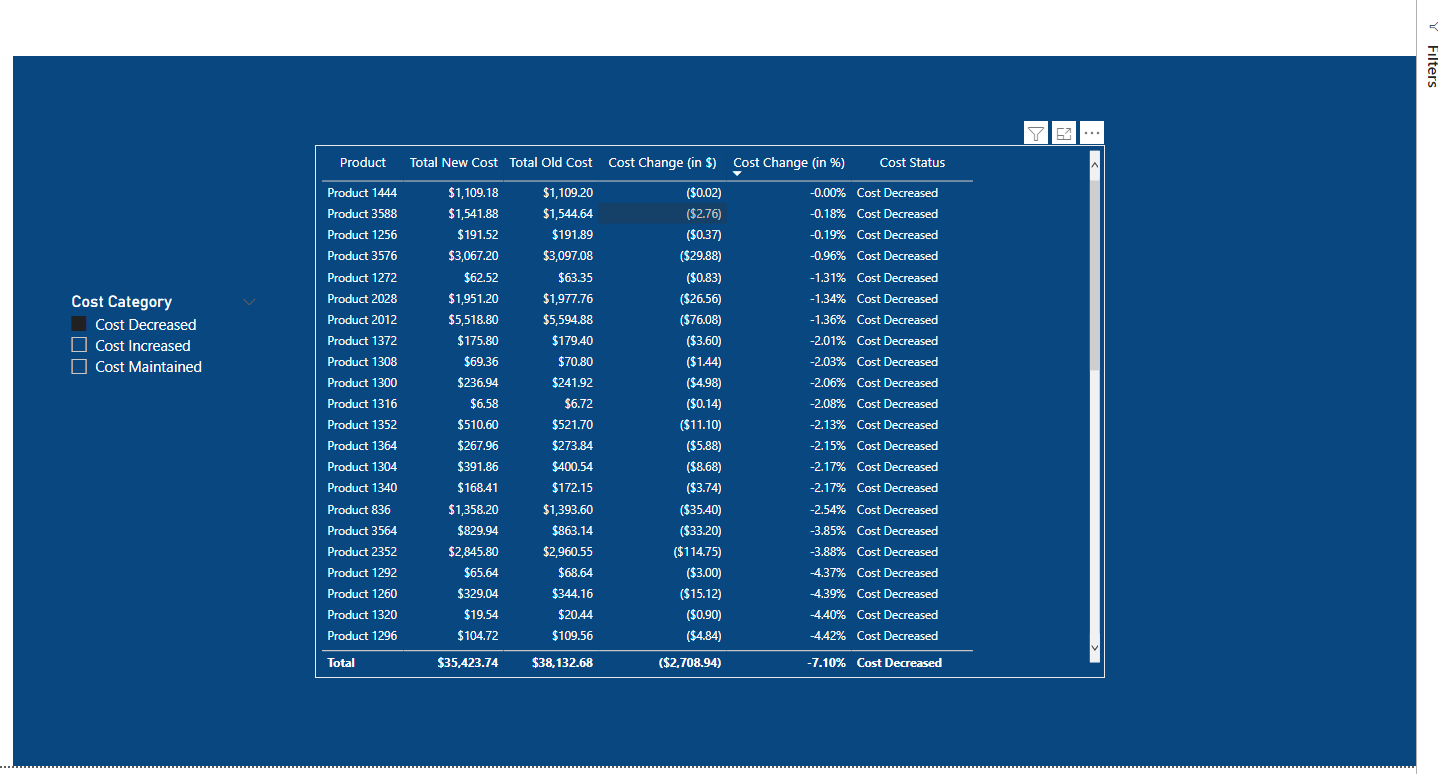
So now you’ll observe that wherever the “Cost Change = $0” it’ll be shown under the category “Cost Maintained” and not under the other categories which was showing earlier. And therefore, by this was we will also have correct results for the “Cost Increased and Cost Decreased” categories.

Finally, before I sign off from this post it’s still not understandable to me about why you’re trying to use the “Grouping and Segmentation Technique” when it can done using the simple formulas and techniques.

In order to show these 3 categories you can either simply create a “Calculated Column” or create a “Measure”. Below are the formula’s provided for the reference

  1. Formula for creating a measure -

     Cost Status = 
     SWITCH( TRUE() , 
         [Cost Change (in $)] < 0 , "Cost Decreased" , 
         [Cost Change (in $)] = 0 , "Cost Maintained" , 
         [Cost Change (in $)] > 0 , "Cost Increased" , 
     BLANK() )
    
  2. Formula for creating a calculated column -

     Cost Difference = 
     SWITCH( TRUE() , 
         ( CALCULATE( [Total New Product Cost] ) - CALCULATE( [Total Old Product Cost] ) ) > 0 , "Cost Increased" , 
         ( CALCULATE( [Total New Product Cost] ) - CALCULATE( [Total Old Product Cost] ) ) = 0 , "Cost Maintained" , 
         ( CALCULATE( [Total New Product Cost] ) - CALCULATE( [Total Old Product Cost] ) ) < 0 , "Cost Decreased" , 
     BLANK() )
    

Note: The reason behind why I created a “Calculated Column” is that I can filter out the results since we cannot place measures under the “Slicers”. So conclusion is out both of these options you can simply create a “Calculated Column” and put it under the “Table Visual” as well as under the “Slicers” there’s no need to create both of them.

I’m also attaching the PBIX file of the working for the reference.

Hoping you’ll find this useful and meets your requirements that you’ve been looking for. :slightly_smiling_face:

Thanks and Warm Regards,
Harsh

Dynamic Grouping - Harsh.pbix (153.3 KB)

3 Likes

You are awesome. I used both SWITCH() and IF functions too, but it was still giving the same problem. I am glad you pointed out the inconsistencies in the data. And I will use your solution in my data. Thanks and thanks again.

Hello @zeekstuarts,

You’re Welcome. :slightly_smiling_face:

I’m glad that I was able to assist you and you found the solution useful.

Thanks and Warm Regards,
Harsh

Thanks to you, I figured out that the inconsistency in the data type contributed to why it wasn’t responsive. The reason I used the grouping method instead of SWITCH or IF was that I wanted to be able to dynamically use slicers to select the Cost categories AND ALSO Price categories (on another page).

Problem arise when I try to create a new calculated column for the Price categories, it throws a circular dependency error. Please advise.

Hello @zeekstuarts,

You’re Welcome. :slightly_smiling_face:

I’m glad that I was able to assist you.

Can you post a new query onto the new thread alongwith the description of the problem and the files attached therewith? So that members of our forum will be able to assist you in a better and efficient manner.

Thanks and Warm Regards,
Harsh

I used the Switch function for this page and it works perfectly with the Slicer (from calculated column)
Cost Category =
SWITCH( TRUE() ,
( [Total New Cost] - [Total Old Cost] ) < 0 , “Cost Decreased” ,
( [Total New Cost] - [Total Old Cost] ) = 0 , “Cost Maintained” ,
( [Total New Cost] - [Total Old Cost] ) > 0 , “Cost Increased” ,
BLANK() )

I was going to apply the same calculated column as in the example above, except the calculated column is throwing circular dependency error.
Price Category =
SWITCH( TRUE() ,
( [Total New Price] - [Total Old Price] ) < 0 , “Cost Decreased” ,
( [Total New Price] - [Total Old Price] ) = 0 , “Cost Maintained” ,
( [Total New Price] - [Total Old Price] ) > 0 , “Cost Increased” ,
BLANK() )


Here I decided to use dynamic grouping, and use the category from the group on the slicer. The problem is getting the slicer to effectively filter the table.

Costing % =
CALCULATE( [Cost Change (in %)],
FILTER( VALUES( ‘Sales Data’[Product] ),
COUNTROWS(
FILTER( ‘Cost Group’,
[Cost Change (in %)] > ‘Cost Group’[Min] &&
[Cost Change (in %)] < ‘Cost Group’[Max] ) ) > 0 ) )

Pricing % =
CALCULATE( [Price Change (in %)],
FILTER( VALUES( ‘Sales Data’[Product] ),
COUNTROWS(
FILTER( ‘Price Group’,
[Price Change (in %)] > ‘Price Group’[Min] &&
[Price Change (in %)] < ‘Price Group’[Max] ) ) > 0 ) )

Here are the .PBIX and source files

Dynamic Group 2.pbix (139.8 KB) SalesDataSource2.xlsx (103.2 KB)

Hello @zeekstuarts,

Well I thought this would have been the only calculation regarding the segmentation which you’re trying to achieve for Costs and so I did in the Fact Table itself. But since now we’ve multiple calculations on this, it’s better to do this in a “Dimension Table” itself rather than performing it in “Fact Table” itself.

I noted that in the recent file provided by you there’s no SKU column which was available in the previous file. So therefore, I added a SKU column into the recent file in order to de-normalize the table and create a “Dimension Table”. Below is the screenshot provided for the reference of the Fact as well as Dimension tables and the relationship created between them.

Fact Table - Sales

Dimension Table - Products

Relationship Status

Now, just add two calculated column into the “Dimension Table” i.e. Products Table and not into the “Fact Table” i.e. Sales Table. Below are the formulas provided for the reference to create a calculated columns -

Cost Difference - Harsh = 
SWITCH( TRUE() , 
    ( CALCULATE( [Total New Product Cost - Harsh] ) - CALCULATE( [Total Old Product Cost - Harsh] ) ) > 0 , "Cost Increased" , 
    ( CALCULATE( [Total New Product Cost - Harsh] ) - CALCULATE( [Total Old Product Cost - Harsh] ) ) = 0 , "Cost Maintained" , 
    ( CALCULATE( [Total New Product Cost - Harsh] ) - CALCULATE( [Total Old Product Cost - Harsh] ) ) < 0 , "Cost Decreased" , 
BLANK() )


Price Difference - Harsh = 
SWITCH( TRUE() , 
    ( CALCULATE( [Total New Product Price - Harsh] ) - CALCULATE( [Total Old Product Price - Harsh] ) ) > 0 , "Price Increased" , 
    ( CALCULATE( [Total New Product Price - Harsh] ) - CALCULATE( [Total Old Product Price - Harsh] ) ) = 0 , "Price Maintained" , 
    ( CALCULATE( [Total New Product Price - Harsh] ) - CALCULATE( [Total Old Product Price - Harsh] ) ) < 0 , "Price Decreased" , 
BLANK() )

So here’s the final result that you’ve been trying to achieve. Below is the screenshot provided for the reference -

Also you can add more calculated columns if you want in the “Dimension Table”, if any in future, and it’ll not give the “Circular Dependency Error” like it gave previously.

I’m also attaching the working of the PBIX file for the reference.

Hoping you find this useful and meets your requirements that you’ve been looking for. :slightly_smiling_face:

Important Note: As per the forum guidelines, once the original query has been solved that thread get’s closed. In order to raise a relating query, please open a new thread so that members of our forum can assist you in a better and efficient manner.

Looping in @EnterpriseDNA to create a new thread for this solution.

Thanks and Warm Regards,
Harsh

Dynamic Grouping - Harsh v2.pbix (216.6 KB)

2 Likes