I have a requirement to apply dynamic column grouping to aggregated data.
The underlying dataset is a table that contains STORE NUMBER, REGION, VOLUME, SALES, FORECAST.
STORE NUMBER
REGION
VOLUME
SALES
FORECAST
1
A
HIGH
100
120
2
A
LOW
20
20
3
B
LOW
30
40
4
C
HIGH
120
180
5
C
HIGH
130
140
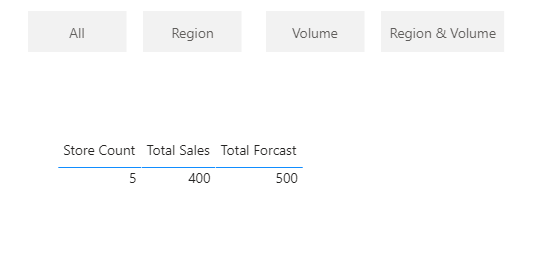
The initial presentation of the data will be as follows. The SALES and FORECAST data will be summed across the entire dataset with a count of total stores.
STORE COUNT
SALES
FORECAST
5
400
500
The users would then like to be apply dynamic grouping of the aggregated dataset without filtering out any of the underlying dataset. In this example, they’d want the options of grouping by data by (1) REGION, (2) VOLUME, or (3) REGION and VOLUME.
Group by REGION
STORE COUNT
REGION
SALES
FORECAST
2
A
120
140
1
B
30
40
2
C
250
320
Group by VOLUME
STORE COUNT
VOLUME
SALES
FORECAST
3
HIGH
350
440
2
LOW
50
60
Group by both REGION and VOLUME
STORE COUNT
REGION
VOLUME
SALES
FORECAST
1
A
HIGH
100
120
1
A
LOW
20
20
1
B
LOW
30
40
2
C
HIGH
250
320
I’ve attempted to use slicers for the selection of the groupings but that ends up filtering per selection as one would expect. Any help or direction on how to support the desired functionality would be much appreciated.
Hi @_mk7, we aim to consistently improve the topics being posted on the forum to help you in getting a strong solution faster. While waiting for a response, here are some tips so you can get the most out of the forum and other Enterprise DNA resources.
Use the forum search to discover if your query has been asked before by another member.
When posting a topic with formula make sure that it is correctly formatted to preformatted text </>.
Use the proper category that best describes your topic
Provide as much context to a question as possible.
Include demo pbix file, images of the entire scenario you are dealing with, screenshot of the data model, details of how you want to visualize a result, and any other supporting links and details.
On the left of the page all separate aggregate tables are visible as illustrated in your post.
On the right, you can right-click a button (in desktop, in the Service a click will do) to be shown the selected aggregate table.
Thanks for the solution, Melissa! This definitely seems feasible for the 2 column example I provided.
The requirement I’m trying to satisfy actually calls for 8 different columns to be “dynamically grouped”. One to many of the columns could be selected in any combination. In order to support all permutations, it seems somewhat unreasonable to have 256 different bookmarks corresponding to each distinct selection possibility.