I am preparing a dynamic Customer Aging report that segments my customers in aging buckets.
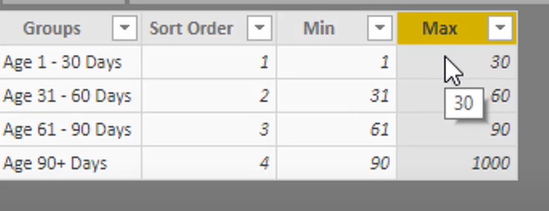
These aging buckets were created using a separate ‘aging table’ - the trick Sam explained in one of his videos. (similar to https://youtu.be/5_KDJGPjMnI )
The “Not due” bucket is causing an error for the 0-value in the Max-column.
The result is not showing anything for this column, if I add range -99999 to 0.
If I, e.g. use -99999 to 1 or -99999 to -1, then it seems to be working perfectly fine.
But this would result in missing the invoices where ‘selected date = due date’.
So please note that my ‘Days Left’-measure can have negative value or zero (if the due date >= selected date). In that case, it should be adding to the ‘Not due’ bucket.
These are my measures :
Invoice Values = IF( ISBLANK([Days Left]), BLANK(), SUM(data_AR[Amount in local currency]) )
**Due Date =** MIN(data_AR[Net due date])
**Posting Date =** MIN(data_AR[Posting date])
**Clearing date =** MIN(data_AR[Clearing date])
**Selected date =** IF( ISBLANK([Posting Date]), BLANK(), MAX('dim_Posting Dates'[Date]) )
**Days Left =**
IF( AND( [Posting Date] <= [Selected date],
OR([Clearing date] > [Selected date], [Clearing date] = BLANK())),
DATEDIFF( [Due Date], [Selected date], DAY ),
BLANK() )
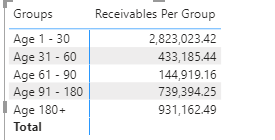
**Receivables Per Group =**
CALCULATE( [Invoice Values],
FILTER( data_AR,
COUNTROWS(
FILTER( 'Aging Groups',
[Days Left] >= 'Aging Groups'[Min] &&
[Days Left] <= 'Aging Groups'[Max] ) )))
May be if you attach the pbx file it may help. From the video, I think you may be missing the following elements.
We need to put less than 1 also in the sort order.
I think the issue is with the [Days Left] logic, not the grouping details. Have you tried building out a table to test this is indeed returning an expected 0 instead of a blank?
If it is blank instead of 0 a quick test would be to try changing the final measure to the one below and see if that works.
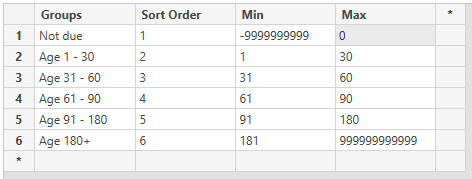
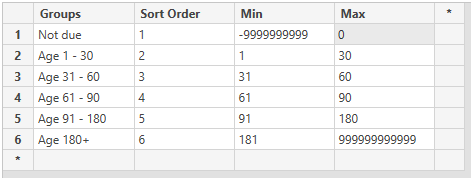
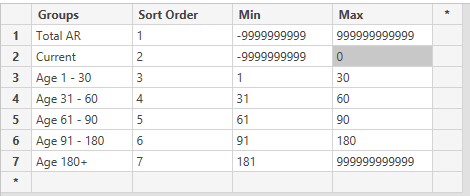
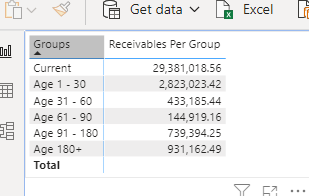
I have included the pbix file with the Aging Groups-table with buckets how they should be:
You will notice both the ‘Total AR’ and ‘Current’ min/max values are causing issues in the calculation:
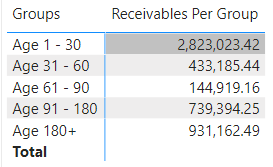
they are actually not showing in the visualisation, also the Total is not visible:
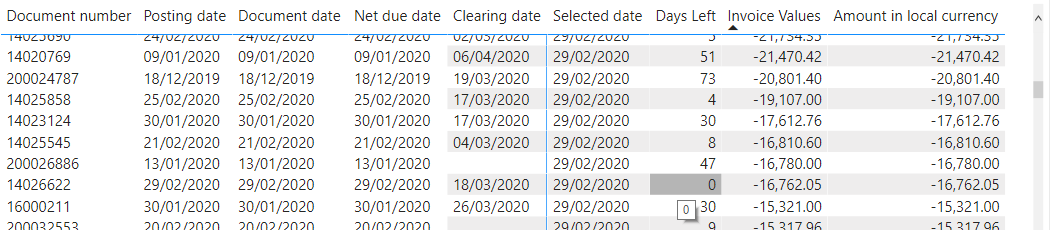
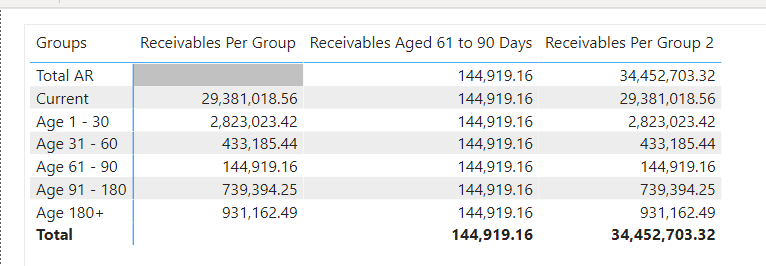
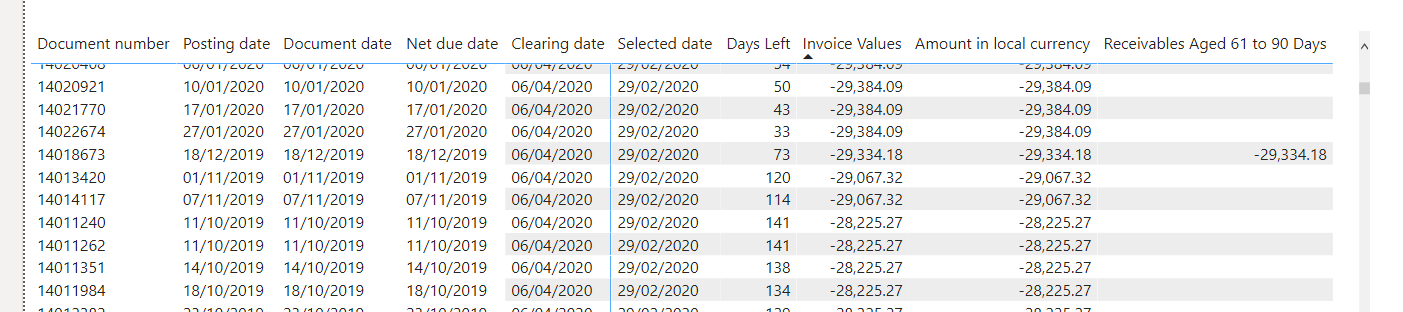
I am unsure whether ‘Days left’-measure is an issue, as you can see from below screenshot the values doe include the 0, hence it should get picked up in the Aging Groups-table.
By the way, a good check to see if the totals/values are correct:
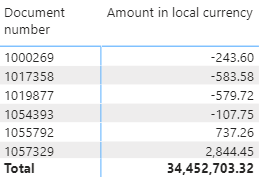
The total AR on selection date 29/02/2020, should be 34.452.703,32.
On 31/12/2019, it should be 35.058.928,42 ;
On 28/02/2019, it should be 20.227.489,35.
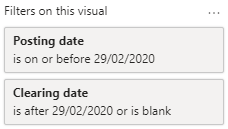
I included one table with the original values and a manual filter for 29/02/2020.
Hi @dillenbram. I haven’t opened you PBIX, but am guessing that having 2 groups ([Total AR], [Current]) that cover partially the same range may be the issue; try removing the [Total AR] group. Hope this helps. Greg
I checked your PBIX, and after adding a HASONEVALUE check to the [Invoice Values] measure, the [Current] group shows up and the value for 29/2/2020 shows correctly.
The original DAX was:
Invoice Values = IF( ISBLANK([Days Left]), BLANK(), SUM(data_AR[Amount in local currency]) )

The revised DAX is:
Invoice Values =
IF(
    HASONEVALUE( data_AR[Net due date] ),
    IF(
        ISBLANK( [Days Left] ),
        BLANK(),
        SUM( data_AR[Amount in local currency] )
    ),
    SUM( data_AR[Amount in local currency] )
)
I’d still remove the [Total AR] group from the [Aging Groups] table; you get a total for free in the matrix or table visual and adding it again can lead to confusion.
Unfortunately, the total AR values don’t change when you try one of your other selected dates; the data model should be revisited.
I updated the Invoice Values-formula & removed the ‘Total AR’ row from the Aging groups.
Unfortunately the total of the AR is not updating when changing the slicer & this is fundamental and the whole purpose of the report.
Slicer functionality did work correctly with the previous Invoice Values-formula, except for the rows ‘Total AR’ and ‘Current’ from the Aging Groups-table.
DAX interacts strange with the “0” value that is being calculated in ‘Days Left’-measure in combination with the Aging Groups-table, but I am unsure why.
Thanks for posting your question @dillenbram. To receive a resolution in a timely manner please make sure that you provide all the necessary details on this thread.
Here is a potential list of additional information to include in this thread; demo pbix file, images of the entire scenario you are dealing with, screenshot of the data model, details of how you want to visualize a result, and any other supporting links and details.
Including all of the above will likely enable a quick solution to your question.
Thank you so much - The formula is working for -99999 to 0 days!
There’s just two remaining questions I have related to the result/format I am trying to get to:
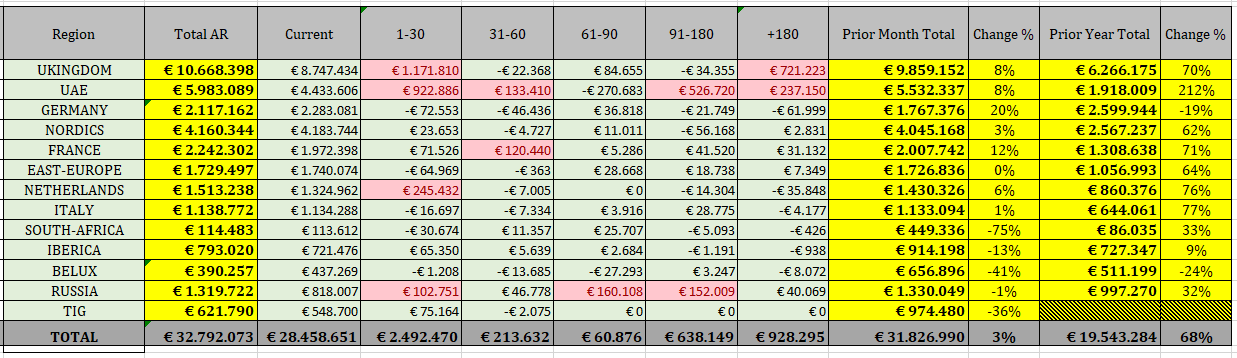
Why isn’t it possible to add a row ‘Total AR’ to the virtual table, to calculate Min -999999 to Max 99999 ? So basically the full AR. When I add this into the virtual table, it doesn’t return any values for that row. I know that the Grand total would result in the same, however I want to show the total in th first row, not the last one, of the table. Desired result example from Excel:
How could I add other columns/data into the same resulting Matrix, that have nothing to do with the Aging buckets? They can include e.g. # of customer accounts, Total prior month AR, total prior year AR, Some comparison columns vs. Total AR (change %) etc.
The reason why I don’t want them added into a separate table next to it, is because I do not want the Region-column repeated on the left side of the matrix. Also, if the user changes the sorting of the region in the first table, the issue would be that it doesn’t automatically resort for the second table, as they are not linked/related. Desired result example from Excel:
(I am already able to get all green-marked items, but not getting to the yellow ones):
Hi @dillenbram, we’ve noticed that no response has been received from you since the 30th of May. We just want to check if you still need further help with this post? In case there won’t be any activity on it in the next few days, we’ll be tagging this post as Solved. If you have a follow question or concern related to this topic, please remove the Solution tag first by clicking the three dots beside Reply and then untick the checkbox. Thanks!