Hello,
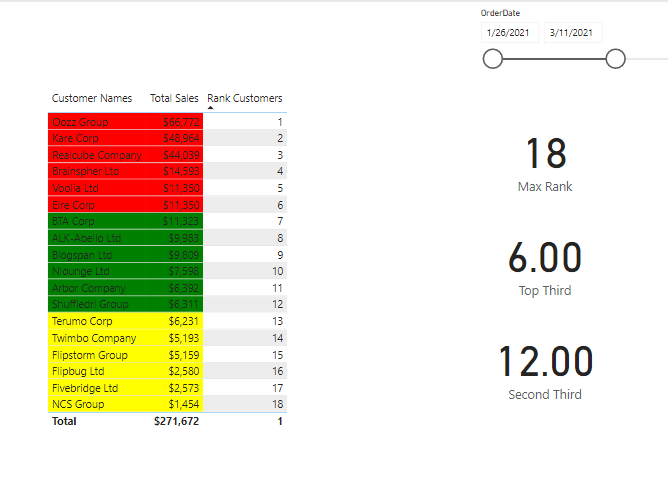
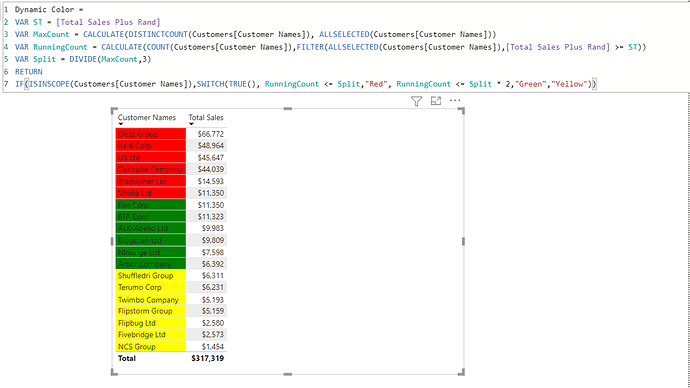
I’m trying to do a conditional formatting on a table creating a measure that would let me color code every 1/3 rows in a table.
For example,
I have a year column which is being used as a slicer. And I have a table with a list of employees and their data which tends to increase or decrease in rows based on the year selected in the slicer. I’m trying to create a measure that would color code every 1/3 rows of employees.
An example would be for the year 2019, I have 9 rows of employees. And the table shows red for the first 3 employees, green for the next 3 and then yellow for the 3 afterwards. However, when the user selects the year 2020, I have 35 rows of employees. How would I make it dynamic so it automatically colors them?

