Hello
I have adapted the financial reporting model tutorial to give a set of measures in a set layout.
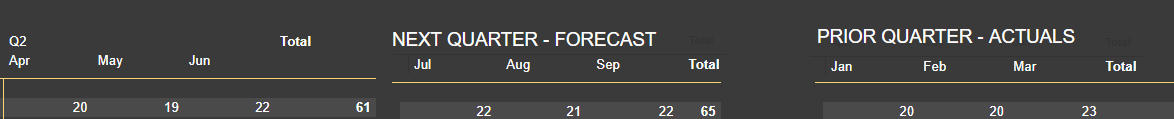
The client wants to see actual values e.g. for Q2, then forecast values for Q3 (Next Quarter) so if the slicer selection is Q2 the column headers will report Apr/May/Jun.
Is there a way of making the Q3(Next Quarter) column headings show as Jul/Aug/Sep ??
I have tried using offset columns from the dimDate table and the measure in the pbix called relative time period but I can’t get it to work - is it possible somehow???
Attaching the pbix file, the scorecard tab shows the differing groups of measures, the Offset months tab shows my workings with the relative time period solution.
Many thanks Lizzie
Syneos Scorecard.pbix (3.8 MB)
Hi @LizzieTompsett,
If you don’t need the matrix visual header and can set fixed column widths, than all you need is just some smoke and mirrors…
What I’ve done is added a separate text box for the Matrix title and another matrix below that for the month names based on a measure. Now order is important.
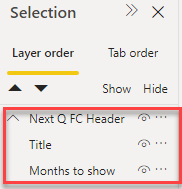
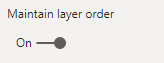
I’ve also set “maintain layer order” for each of these visuals including the Matrix containing the values below that.
Here’s the measure to display month names for the next Q
Months to show next =
VAR vTable =
    CALCULATETABLE( VALUES( dimDate[Month Name] ),
        DATEADD( dimDate[Date], 1, QUARTER )
    )
RETURN

IF( NOT( ISINSCOPE( dimDate[Month Name] )), "Total",
    FIRSTNONBLANK( vTable, [Month Name] )
)
Here’s your sample file
Syneos Scorecard.pbix (3.8 MB)
I hope this is helpful
3 Likes
Hi Melissa - this works just fine, thanks for responding so quickly, I really appreciate it, Lizzie