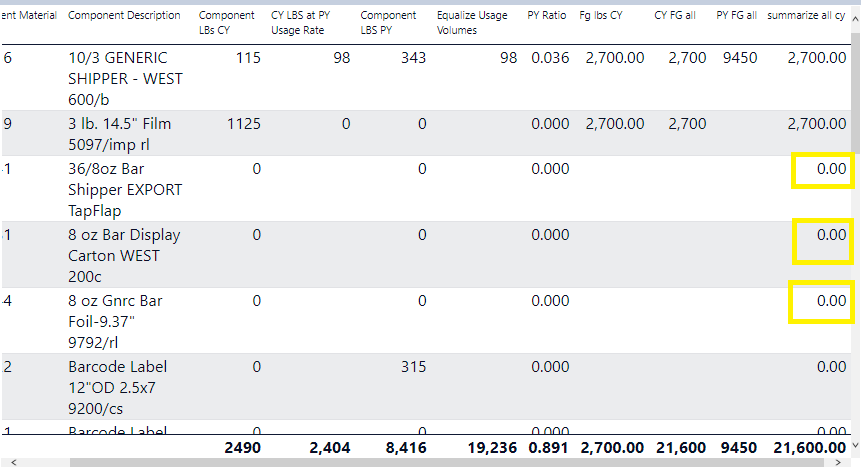
You can try below formula and it should work. I should checked if it shows blank, it should change it to 0.
summarize all cy =
VAR myMeasure = sumx(SUMMARIZE(‘All data new’,‘All data new’[Component Material], ‘All data new’[Component Description], ‘All data new’[Material]),[CY FG all])
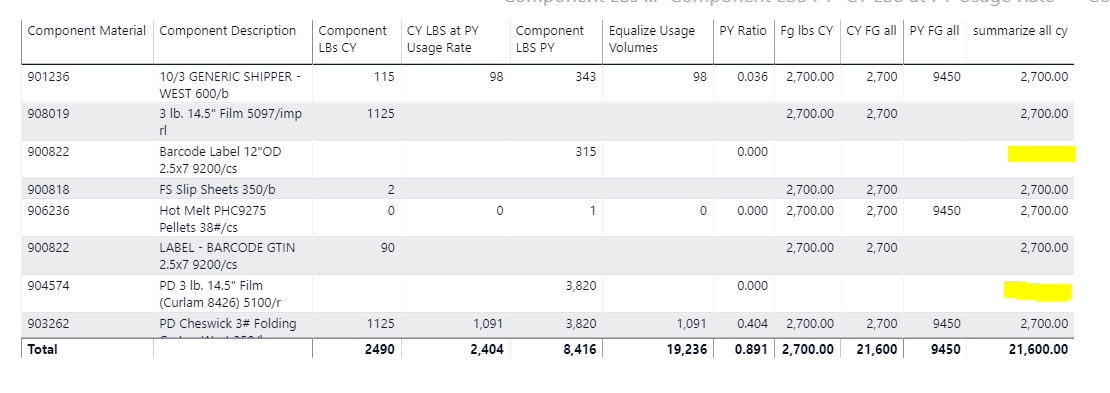
I should have been more specific. I want to return the same result for where there is a blank or 0. For every material/component combination, I need to display the total finished goods produced. 2700 needs to appear on every line of that column.
I can’t use allselected() because that only works when an individual material/component combination is filtered on. I need something that sticks when all materials are selected and displays the correct totals.
Any chance that you’ve been able to take a look at this puzzle? No one that I’ve talked to seems able to solve it. I believe that it is an issue where I need to overcome some filters.
I need the same subtotal of the FG’s to copy down for CY and PY for each FG. When I filter on an individual material, the calculation is perfect. When I unfilter, it’s garbage. What am I missing?
Display of what I need to achieve when filtered on a specific FG and unfilter to see all FG’s.
I haven’t had a chance to yet. Been working on a couple of extended support requests this week, and owe @SamSPAIN a response first, but will take a look at it as soon as I’ve finished that one.
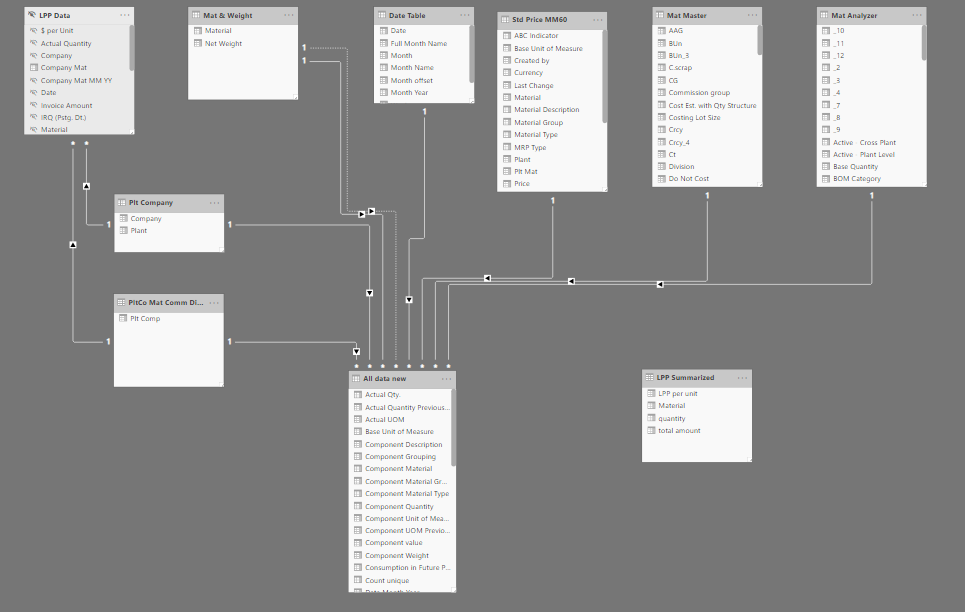
I’m digging into this one now, but first wanted to give a big thumbs up to the great work you’ve done reworking your data model. When we worked on the totals/filter conditions issues back in Dec, this model was chockablock with inactive and bidirectional relationships, making it pretty hard to follow. If you don’t mind, I wanted to offer two suggestions, which I think will simplify/clarify it even further:
Use TREATAS to get rid of the two bridge tables. Will make your DAX slightly more complicated, but IMO that is more than offset by the simplicity gains in the data model.
Display the model in Collie format, with the dimension tables all at the top level, so visually all the relationships/filters flow “downhill”:
@sam.mckay promotes this as a best practice, and I completely agree that it makes any data model clearer and more intuitive (I find it also really helps me better visualize what DAX is doing).
Will get back to you later today on the issue at hand, but just wanted to let you know that I think the overall model is looking good.
Haven’t forgotten about you here. Still working on cracking this one…
Brian
UPDATE 2/18: still working this. Breaking some of the larger measures down into components to try to isolate the problem, and rewriting some of the more complex nested ifs as SWITCH statements to test /confirm the logic. Welcome any other forum members’ eyes on this one as well…
I agree with you that this is likely a filter override issue, but have been unable to pinpoint the source of the problem, even after wrestling with it over multiple nights . I have called for reinforcements - sending this back to the entire expert team. Hopefully, more eyes on the problem will identify a solution. Sorry for the delay.
Thank you for continuing to explore this one, @BrianJ. I appreciate all of your help so far and commitment to getting to the bottom of this analysis. Once it’s done, this will make a shareable case-study, hopefully.
I copied it into your most recent PBIX and it looks like it returns the proper values regardless of what is selected in the month slicer (or no selection at all).
Thank you, @BrianJ. For individual materials that I filter on, I see that it works great. However, when I unfilter to show all materials for the plant, the subtotal is by cumulative finished goods for the whole plant, instead of the FG subtotal, sku by sku. Any thoughts on how to control this?
I’m hoping you can save me a lot of time because I might be missing some vital context here… Could you explain your requirement again in more detail by supplying some concrete examples of your filter settings and the expected results?
That will be a big help in working through this issue. Thanks in advance.
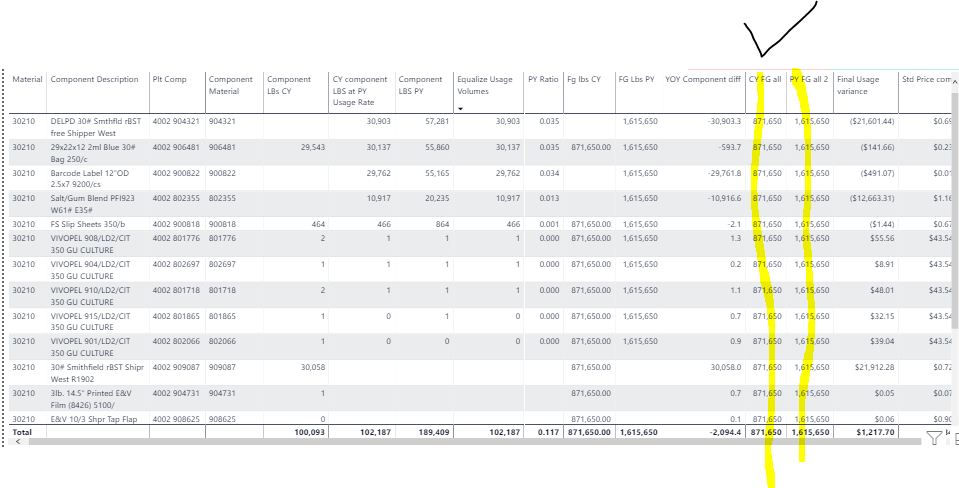
In short summary, we produce many finished goods (FG) at each plant. Each finished good consumes various resources (components). We need to compare how much of each component was consumed to produce FGs this year and last year for the same time period.
The trick is, though, that for some components, we have substitutions yoy and the same material sku won’t be used but a similar sku in the same classifcation will be.
The calculations in the workbook is to divide the Cy component lbs over the CY FG lbs. That gives us a ratio of usage. We then divide PY component lbs by the PY FG lbs. Next, we multiply the PY usage rate by the CY FG lbs. That is why having the FG amount for both years is so critical to this analysis functioning properly.
We then need this analysis to show the results correctly for both individual SKUs and all SKUs when the filter context is changed.
Due to the length by which this post has been active, we are tagging it as Solved. For further questions related to this post, please make a new thread. You may check this how-to guide for reference - How To Use The Enterprise DNA Support Forum
Sorry – can we keep this one open a bit longer too? @melissa and I are still actively working this one. Rough week last week, and I’m behind on my part on this one as well as the one for @bare. Apologies for the delay - back on it this week. Thanks.