Displaying Segment Groups

Hi There

I can’t work this out!
I have a classic Sales Table. Customer sales go up and down, so I’ve segmented my customers in Groups - High, Med, Low - and this changes every month. A customer can move from High to Med to Low and back again over a series of months.

I hold this in a table, Cust ID, Segment Class (Hi, Med, Low) and Month (the various Customers in each group that month). These are calculated outside of BI.

What I want to show is the various sales by Month for the total class so that I can see (eg) Total Customer Sales by Hi for each of the previous months. That will allow me to see if Hi customers are increasing / decreasing etc.

I can’t think how I would link this on a data model. I can link Class to Customer to Sales table, but this will only return Total Sales, as I can’t work the Date dimension into the model. I (think I) want All Customers in a Class in this month; total sales for that month for this customers. That creates too many date relationships in the model.

Amy Clues?

This can all be done in Power BI using segmentation techniques and formulas.

Check out the below example

Some other examples of similar techniques below

Hi,

Thanks for those examples. The challenge is slightly different.
The segmentation is done on a different platform so it can be published across many systems. In effect it creates a table with Customer Classification - (say) Good, Med, Bad; a customer ID, which customers sit in each group; and a month, which is the month the customer sat in that group. So importantly a customer can move across a group month on month. This granularity allows Customer behaviour to be tracked on a granular basis.

So if I choose Good Customers, then the cohort will change month on month.

I also have:
A customer reference table - Customer ID, Location, Contact details etc. All static information.
A Sales table which has invoices by Date(ddmmyy); Value; Customer ID
A Date Table with ddmmyy and of course Month (to connect with Month in the Customer Segment table)
What I want to show is how the make up of Good, Med, Bad changes month on month. This will change by make up of the Customers on a monthly basis as Customers move across each of those groups. It is not dynamic, it is set by the Segmentation Platform.
I want to create something akin to Cash Flow, but called Customer Flow. So month on month how does the make up of Good change by Value, Volume, Margin etc.

But I can’t work out how to do that? Make sense?

I think I would have to see an example of the scenario in a Power BI model to offer any assistance here.

Sometimes these calculations can be complex, depending on the data structure and how you want to ultimately show it within a report page.

If you could set something up and send it through that would be helpful.

Thanks

Hi,

I annonomised all this so its good to browse.
The basic output I am looking is like this:

Segment Q1 2017 Q2 2017 Q3 2017 Q4 2017
Platinum £1,234 £2,455 £3,456 £3,456
Gold £1,234 £2,455 £3,456 £3,456
Silver £1,234 £2,455 £3,456 £3,456
Bronze £1,234 £2,455 £3,456 £3,456
Transactional £1,234 £2,455 £3,456 £3,456

The numbers are mis-leading, but you can see I want to see how the Segment Groups vary over time. So are good customers spending more or less. Then to drill down and see what customers make up Gold and why are they spending more or less - more product, different prices etc. Once I have the basic construct then I can drill down for hours on the make up.

I set up this pbix to show the basics.
Segment Example.pbix (1.5 MB)

The data model isn’t correct but I was playing with connections.
So the key tables are
Invoice Table - all the raw data
Date Table
Cust Ref Table - reference data on a Customer
CustSegmentbyQ - So in each quarter customers are one of P,G,S,B,T and then they possibly move to segment in the next Q.
I put a key measure of Total Sales just to try and work it out.

I almost want to create a virtual table each time, of all the customers in a segment in a quarter, and total the sales for the selection, but I can’t.

I think it is a combination of date logic and the relationship between a Customer ID and the Invoicetable.

I’m not sure whether I should be amending the Raw Data (one way might be to do all the totalling outside of BI and just have another fact table - add Total Sales to Cust Segment by Q);
OR creating logic in the data model - the QQ-YYYY link table has a role but doesn’t play fair, and when I connect CustSegment to CustRef I get circular many to many relationships

Or if there is some commands I don’t know yet.

Or, probably all of the above!

To me this looks nothing different to the standard patterns I’ve reference above for grouping and banding information.

I’ve had a look at the demo model and it’s seems the same. There’s no difference to the scenarios really.

Not to sure what this is doing below, doesn’t seem necessary

This table here isn’t sufficient because it doesn’t contain the information required to group any of the results

image

After looking at this even more I just can’t see any difference to what you are trying to do here to the example I placed above. It’s exactly the same.

You only need one virtual table here laying out the bounds for each group.

By doing this then you will see how the spending within these groups change over time and also who is doing the spending within those groups.

Really review the below example. This shows you exactly how to do this.

This is the formula pattern you need to use (with you’re own inputs)

This is the type of table you require as a virtual table with no relationship to the core model

This same formula can then be used in the same context you require it as per below…you just need to set up a matrix with the correct inputs

image

This also here is all you need for your core model (nothing else is required from what I can see, other than your virtual table)

image

Have a go really working through this example and try to replicate everything.

Thanks
Sam

Hi,

I think my example is different in a couple of material ways:
Segmentation Business Rules - are more complex than a min, max sales figure. That is why they are developed in a different application which has access to more data. That core system then shares that segmentation output across many applications, not just BI. It wouldn’t make sense to try to replicate that logic in BI.
The segmentation values are dynamic. In the your example, the ‘business rules’ are hard coded and don’t change in response to customer behaviour. If for example, there is a period of poor weather and sales drop because no-one purchases anything, then all customers become bad in that period. The segmentation I am working with looks at all customer behaviour in one month and then classifies all customers in that month, so a good customer will still be good relative to all customers even if there total spend is lower - providing all customers are spending less that month.

The segmentation reporting needs to show Period on Period movements and the underlying metrics of those customers who have moved. In the example total profits are calculated across all period included in the filter. I need to show which customers have moved across segments Period on Period and then provide Insight as to why. Similarly I need to show insight across the entire segment as well.

Apologies for my model not making sense to you. I did say it was an n th iteration and would not be correct.

I going to look at the problem differently. The use of the Segmentation word kicks off a different train of thought. It is essentially a reporting challenge with different groupings across different periods.

Ok thanks for the reply,

It seems that maybe there is a bit more to it…possibly outside Power BI itself.

If there is more to it, then the best way for me or other to assist from here is to create the exact example in a demo model and then we can have a look at it.

The best way to get on point assistance is to start working up the example, begin working on the formula and then see where you get to. Then we can come in and adjust things where is seems logical.

Thanks
Sam

Hi Sam

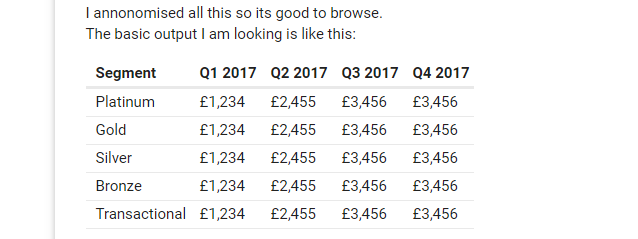
I’ve spent time trying to work this out but no success. Leaving aside the segmentation word the Insight I am looking for is essentially:

Segment Q1 2017 Q2 2017 Q3 2017 Q4 2017
Platinum £1,234 £1,489 £1,394 £1,653
Gold £1,034 £1,000 £983 £1,109
Silver £1,456 £1,234 £1,289 £1,673
Bronze £1,390 £1,456 £1,364 £1,340
Transactional £984 £1,100 £1,090 £1,285

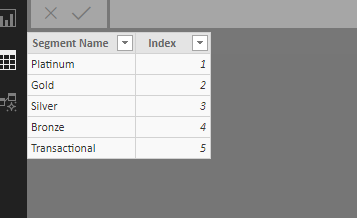
Each segment is made up of a number of customers that varies depending on certain business rules. The higher segments have fewer customers, but they spend more.

What I get each Q is the table that classifies a Customer ID as one of Plat, Gold, Silver etc and the Quarter that relates to. A customer can move across PGSBT, and that is the valuable piece of Insight - why did a customer move? how do you move them back up to remain valuable?

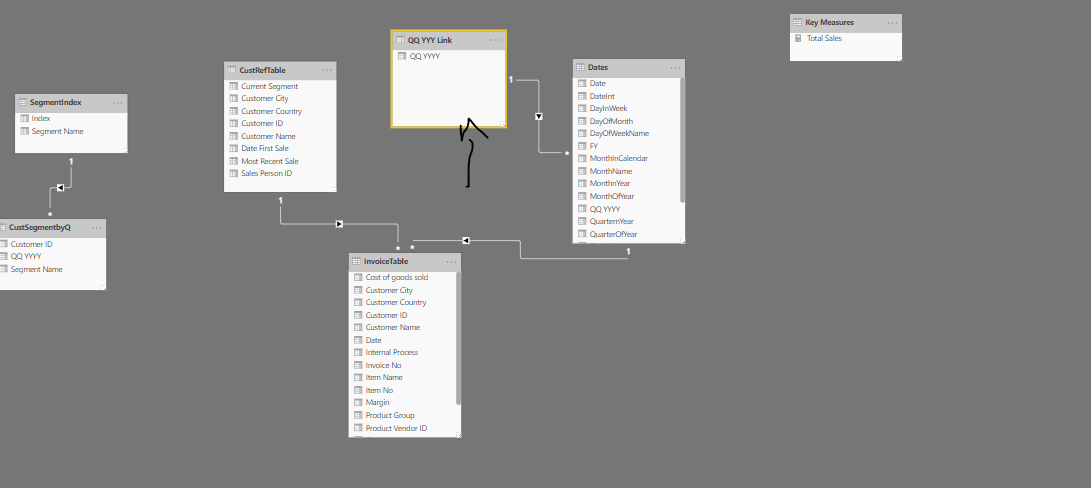
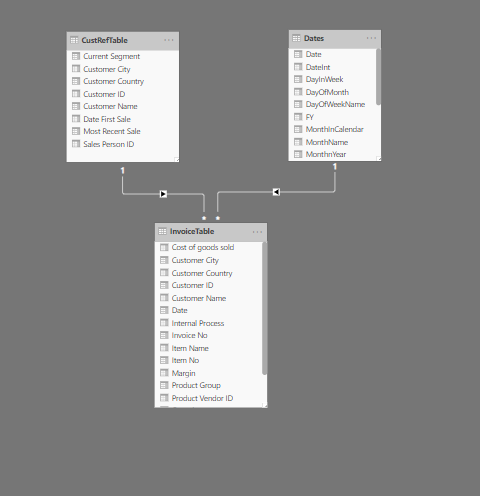
The CustomerSegmentbyQ table is the table that list, Segment, Quarter, Customer ID. Where a customer resides for each quarter.

This has a link to the InvoiceTable and I’ve tried to create this link by connecting the Quarter to all the dates, (QQ YYYY Link) to allow all the invoices for that period to be totalled. But when I try this I’m not getting any correct Sales Totals.
Segment Example SC1.pbix (1.5 MB)

So that makes me think there is something wrong with the data model so I’ll change it. I’ve added a Many:1 relationship from the CustomerSegmentbyQ table to the Cust Ref table. My thinking being that the CustSegbyQ table has a unique Cust ID for each Seg / Q combination, which should then allow a unique customer Id to be found in the reference table and then all those invoices totalled. But alas no.

Segment Example SC2.pbix (1.5 MB)

I have spun round various iterations and not got a result.

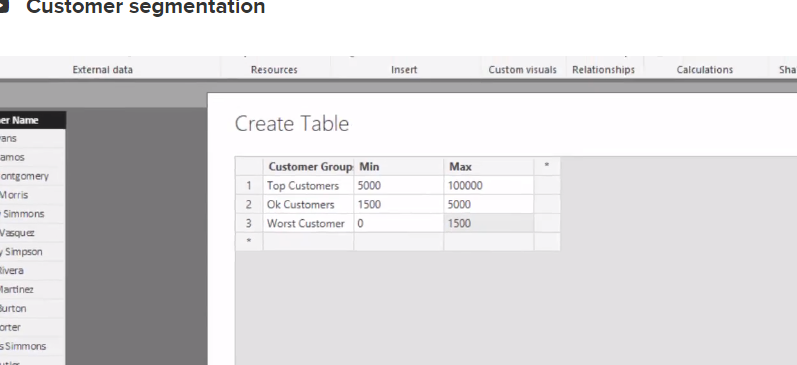
The core tables are as in these examples. One way round it is to make CustomerSegmentbyQ effectively a Fact Table. Populate it with Sales and all other totals outside of BI and just load it in. That will allow Visualisations to be created etc.

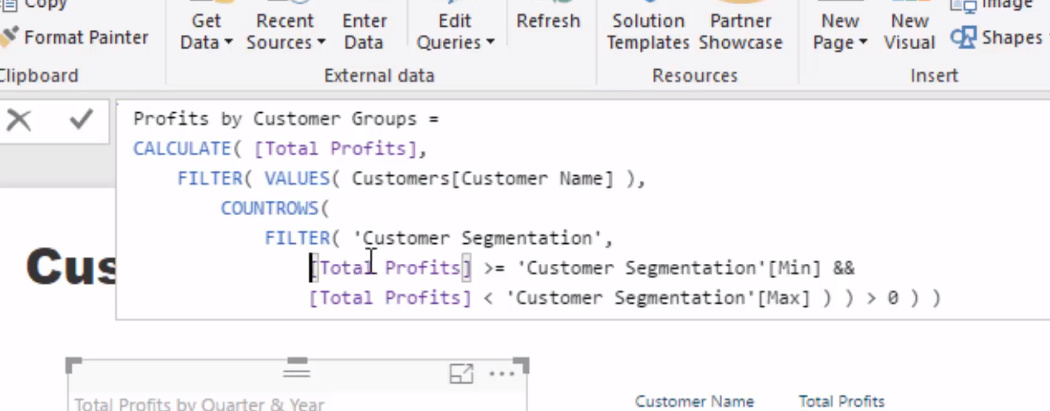
But I think there must be another way. One way I tried exploring, but couldn’t get the syntax correct is to create VAR which tried to pass the Customer ID List for each Q / Segment combination to a Calculation, which I think would work.

So just need help with:
Is it too complex for Power BI and I should do heavy processing outside
Is it something that is relatively straightforward just beyond my current skill set.
If so, is the answer in VAR and some virtual table magic I don’t yet understand

Hi @Boney,

I’ve read through your posts from the perspective of getting the data that you want per customer per time period. In your initial post, you indicated that you already have a table with the “Cust ID, Segment Class (Hi, Med, Low) and Month”.

I believe all you really need is a calculated column on that table with the total sales for each customer for that month. You would pull that from the Invoice table at load time. Because it is a calculated column, you no longer have to worry about data model relationships when doing aggregations on sales by customer, segment, and/or month.

There is quite a bit about quarters after the initial post, so if you really care only about quarters and not months, then your table should have the quarter right on it and not the month (such as the “QQ YYYY” I see in one of the screenshots).

If you do care about months, with the option to consider quarters and/or years, you may need to store an actual date on your table to represent the month that can then be joined to the Dates table in the model by individual date. For example, the first day of the month (easiest) or the last day. Then you won’t get the ambiguous reference error with a many-to-many relationship, and you can pull the quarter and year for that date.

In my vision of this data model, InvoiceTable is joined to Dates and the Customer/Segment/Month is joined to Dates, but InvoiceTable and Customer/Segment/Month are not joined together.

I know calculated columns are a bit of a file size hit, but in Sam’s training and my own work I have seen where they can in fact be essential, largely due to situations where data model relationships just don’t work quite as needed. I hope this suggestion helps you with a solution. Please let us know how it works out.

John C. Pratt
Enterprise%20DNA%20Expert%20-%20Small

Thanks for that John I was wondering if that was the way round it. It is a little learn on getting the data design right.

I was thinking though that with those total sales figures available, the next bit of Insight will be creating no of invoices, units sold etc for the same combinations. Now two things come to mind.

Do I create a Variable that is the Customer ID’s in a particular QQ / Segment and use that as an input to a CALCULATE measure?

Or, extending the data model some what, do I add the Segment Name to the Invoice Table. So I could, as part of the pre-processing, add the Segment Classification to the Invoice Table. Then I would have everything available. It would mean every Invoice is classified but that is do-able I think?

@Boney, I knew as I was writing my last reply that the real details are in how you need to “analyze” the data after getting the aggregations working. There wasn’t enough info to provide guidance on that, and it gets real complex real fast because there are so many possible variables. I will also note that I do not claim to be a DAX expert (yet). It is another programming language that I am working on learning.

So, I do know that it is possible, for example, to create table variables that can be used in DAX calculations. Sam does that all the time, but each use case is slightly different. With the data model I described, you also have some very cool filters available as you mentioned in the 3rd paragraph, and this is where I suggest you start.

You can filter the InvoiceTable by a single customer, all customers in a given time period and/or segment, and potentially look at time period Y vs. time period X, as selected from the customer/segment/period table.

I don’t think you need to add columns to the InvoiceTable as mentioned in the 4th paragraph because I believe you can filter the invoice records as needed since every invoice record already has a customer ID and a specific date which automatically puts it in a specific time period (month, quarter, year, etc.).

If the filter expressions/variables for CALCULATE() meet your needs, you should be all set.

John C. Pratt
Enterprise%20DNA%20Expert%20-%20Small