Displaying Names in a Table

Hi

I have a list of members and I have created a measure using Calculate to get the list of members who are life members.

I now want to display the life members as a table.

However when I select table and use my life member measure, I only get a number (13).

If I add my Member Name field to the table I now get my life members showing but I also have an additional column with the number 1 in each row - see graphic.

I don’t want the additional column called NZ Life Members. I only want to display the life members names in a single column.

I’m sure there’s an easy solution to this but I can’t seem to work it out or find a solution with Google.

Thanks

Jonathan

image

@KieftyKids,

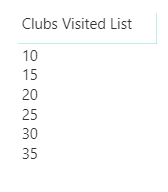
I worked out a similar solution with another member a few months ago. It’s definitely trickier than it seems at first glance, because you have to apply all the context within the measure, and then get it to generate the vertical list. The trick is to use CONCATENATEX() with UNICHAR(10) as the delimiter (UNICHAR(10) = hard return).

Clubs Visited List = 

CALCULATE(
    CONCATENATEX(
       VALUES('Sales Data'[Club Code]),
       'Sales Data'[Club Code],
       UNICHAR(10),
       'Sales Data'[Club Code],
       ASC
    ),
    FILTER(
        'Sales Data',
        [Visited] = 1
    ),
    VALUES( 'Members'[Member Code] )
) 

image

I’ve attached the full solution file, which should make it relatively straightforward to adapt this measure to your specific data.

Hope this is helpful. If you have any problems, please just post your PBIX and we can work through a more specific solution.

1 Like

Thank you! I’ll try it.

To the contributors of this post, thank you for all your inputs on this topic we are now tagging it as Solved. To help us learn more about your experience in the forum, please take a moment to answer this short forum survey. We appreciate all your help and suggestions. Thanks!