Hi @iasma, we aim to consistently improve the topics being posted on the forum to help you in getting a strong solution faster. While waiting for a response, here are some tips so you can get the most out of the forum and other Enterprise DNA resources.
Use the forum search to discover if your query has been asked before by another member.
When posting a topic with formula make sure that it is correctly formatted to preformatted text </>.
Use the proper category that best describes your topic
Provide as much contextn to a question as possible.
*Include the masked demo pbix file, images of the entire scenario you are dealing with, screenshot of the data model, details of how you want to visualize a result, and any other supporting links and details.
Hi @iasma. It should be done by default by Power BI. I suspect its your data model, but not sure what your issue is. Please post your work-in-progress PBIX file to help the forum members pursue further.
Greg
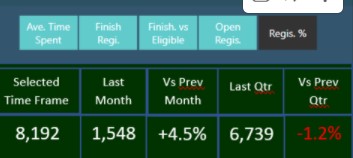
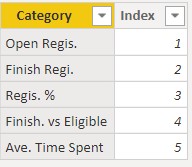
I wanna be able to click on whatever category from table 1 and get all the values for table 2.
I have all the calculations for all of them already. But I couldn’t figure out the logic of how to create this connection between them.
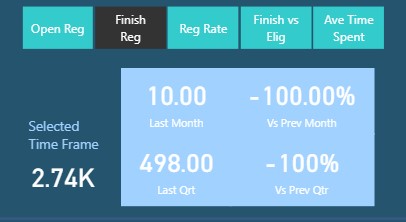
I used the dynamic button but I couldn’t get all the values at once.
Hi @iasma. Unfortunately, still not clear what the issue is. Again, very difficult to comment without a PBIX to view and play with your data model. Please post your work-in-progress PBIX and Excel mock-ups of your desired outcome for the forum members to review.
Greg
Hi @iasma, we’ve noticed that no response has been received from you since the 23rd of January. We are waiting for the masked masked demo pbix file.
This will help other users and experts to answer your inquiry better. In case there won’t be any activity on it in the next few days, we’ll be tagging this post as Solved.