This is a great example of why it’s always important to look at the underlying data and data model in the PBIX. What jumped out to me as soon as I looked at it is that you are trying to manage time-based data without a Date Table, just using calculated columns in your fact table. This is always going to cause major problems. Thus, what I did was added the Extended Date Table to your data model. In order to build a relationship between the date table and your Program Footprint Milestones table, in Power Query I created a new field called First Day of the Month, which I created from the month and year fields for each milestone.
Now your data model looks like this, and can easily manage time-intelligence based measures and visuals:

Once that was done, the next step was to build a measure that would return the correct milestone data for each month. A rule of DAX is that a measure must return a scalar (i.e., a single value). However, we can use one of my favorite tricks, the combination of the CONCATENATEX() function and UNICHAR( 10) which returns a hard return as the delimiter in the CONCATENATEX() function, to return a scalar value that actually contains multiple milestones:
ConcatX Milestones =

CALCULATE(
    CONCATENATEX(
        program_footprint_milestones,
        program_footprint_milestones[Milestones],
        UNICHAR( 10 )
    ),
    FILTER(
        program_footprint_milestones,
        program_footprint_milestones[Milestones] <> BLANK()
    )
)
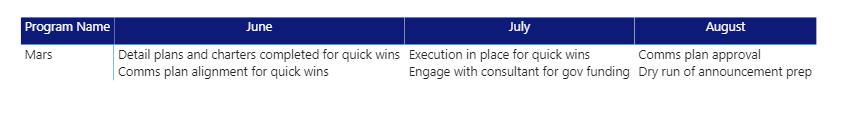
Put it all together in the matrix and presto!
I hope this is helpful. Full solution file below.
- Brian
eDNA Forum - Milestones solution.pbix (149.3 KB)
https://info.enterprisedna.co/dax-function-guide/concatenatex/