How can I show different measures for different rows in a table visualization? For the screenshot below I need to show the 349930 number where the 443200 number is.
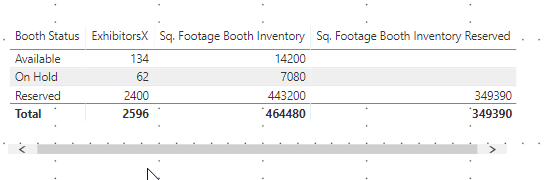
How can I show different measures for different rows in a table visualization? For the screenshot below I need to show the 349930 number where the 443200 number is.
Here is another video from Sam that will help you figure this out. You will need to use a SWITCH statement to come up with your end result. SWITCH is something that you should become familiar with, I use it frequently when building solution for other users.

Thanks
![]()
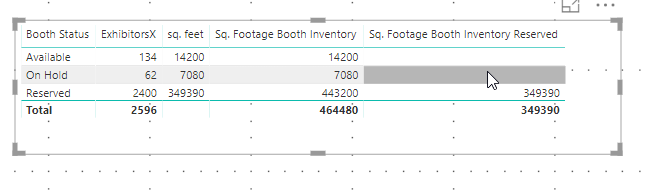
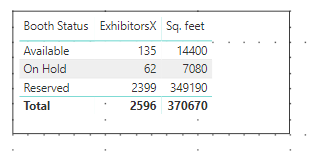
Thanks, I was able to get part of it right with this formula:
sq. feet =
IF(
HASONEVALUE(‘Booth Inventory’[Booth Status]),
IF(VALUES(‘Booth Inventory’[Booth Status])=“Reserved”,
[Sq. Footage Booth Inventory Reserved],
[Sq. Footage Booth Inventory]), blank() )
I do understand that based on this formula there will be a blank value in the Total. How can I get the total line to be 14200 + 7080 + 349390 ? This is [Sq. Footage Booth Inventory] for both “Available” and “On Hold” + [Sq. Footage Booth Inventory Reserved] for the reserved line.
Please send over a sample PBIX file so I can work this out. You have the right idea, but the SWITCH statement will be much easier to use than what you currently have.
Thanks
![]()
Here is the .pbix file - I was able to do it but maybe there is a better way! T.I.A.
 MYS Uploaded.pbix (209.4 KB)
I will have a look. That is what is so great about Power BI is there are multiple way to come up with the same result.
Cheers!
![]()
Here is solution I came up with using SWITCH, Your measure and mine will both give you the end result you want. Using SWITCH over IF will definitely give you a better structured measure.
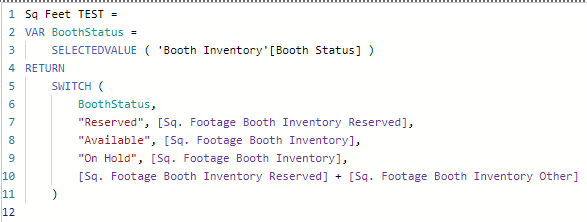
Thanks
![]()
Thank you so much Enterprise DNA Team! Keep it up the content on your site is amazing and SUPER informative.
Best Matt