I’d like to have the difference between and amongst the years
I’d like to have the difference between and amongst the years
Hi @mohammedkhan11,
Can you explain in détail what you want to see in the visual. And if you can upload a pbix demo file. that would be great !
The Picture I have attached is the Matrix Visual
In the Columns I have added the Fiscal years, The Fiscal Year is Added through Slicer
Instead of the SubTotal, I’d like to know the Differences of the amount in the end
Let me know if you need any further clarification.
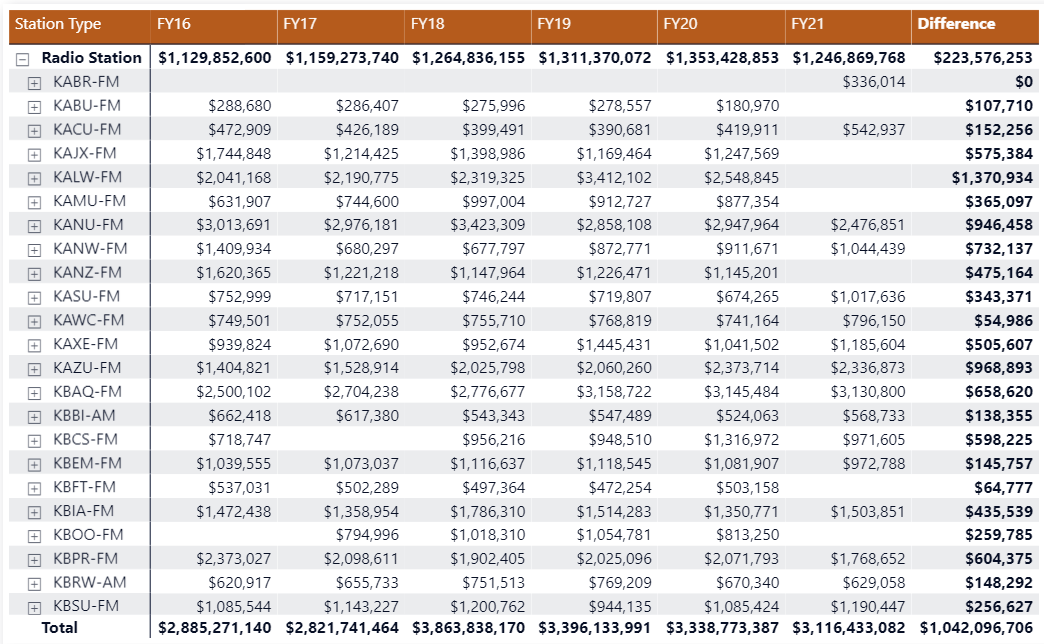
I have a Table in which it has Stattion Type, total Rev (meaasure) and Year
Matrix Looks this:
| Station Type | 2015 | 2016 | 2017 | 2018 |
|---|---|---|---|---|
| ABC | 10 | 8 | 20 | 15 |
| XYZ | 12 | 6 | 15 | 10 |
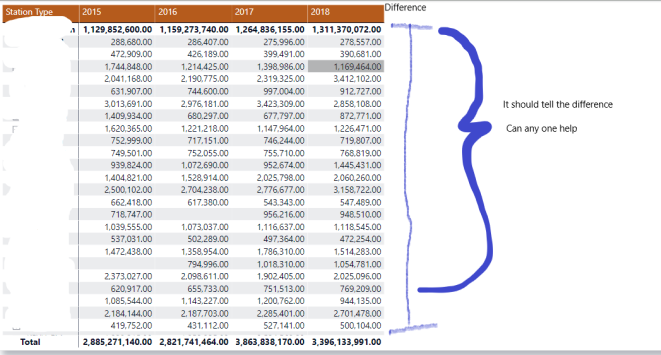
And Need Something better or like this
| Station Type | 2015 | 2016 | Difference | 2017 | 2018 | Difference |
|---|---|---|---|---|---|---|
| ABC | 10 | 8 | 2 | 20 | 15 | 5 |
| XYZ | 12 | 6 | 6 | 15 | 10 | 5 |
Hope this would help in understanding
Hi @mohammedkhan11. To help the forum members visualize your issue and perform their analyses, please attach your work-in-progress PBIX. If you’d like to sanitize your data, @BrianJ has a great video on YouTube.

Whether real, sanitized, or sample data, please provide as well a marked-up screenshot or (ideally) an Excel mockup of the exact outcome you’re looking for.
Greg
Hi @Greg I have attached a file and have few other issues
Can I add another issue to this or do i have to wait till this get resolved and then move on to another
Req1:
I want to add the from the Value Column but only from the selected line order from
Such as
Schedule A has all the Lines Items so only selected Line Order should be selected
such as 1,3,4,5,6,7,8,9,11,13.1,14.1,15,16,17,18,19, 20,21
and
Schedule E has all the line items so only select line order should be selected such as
1,2,3,5,6,7,8
Req2:
I want total of the station type for each year and i can also get the difference for
Sample of the Matrix Visual:
| Station Type | 2015 | 2016 | 2017 | 2018 |
|---|---|---|---|---|
| ABC | 10 | 8 | 20 | 15 |
| XYZ | 12 | 6 | 15 | 10 |
And Need Something better or like this in the Matrix Visual
| Station Type | 2015 | 2016 | 2017 | 2018 | Difference |
|---|---|---|---|---|---|
| ABC | 10 | 8 | 2 | 20 | 15 |
| XYZ | 12 | 6 | 6 | 15 | 10 |
Sample File.pbix (11.2 MB)
@mohammedkhan11 I am not sure but maybe these are close to what you are looking for. In both I did change the matrix to use the Date(2)[FY]
Difference per year
Revenue = SUM('Rev Table'[value])
 Revenue Last YEAR =
 VAR ly =
     SELECTEDVALUE ( 'Date( 2 )'[Year] ) - 1
 VAR rev = [Revenue]
 VAR lyrev =
     CALCULATE ( [Revenue], REMOVEFILTERS ( 'Date( 2 )' ), 'Date( 2 )'[Year] = ly )
 RETURN
     IF ( OR ( ISBLANK ( rev ), ISBLANK ( lyrev ) ), BLANK (), lyrev )
Difference =
VAR ly =
SELECTEDVALUE ( ‘Date (2)’[Year] ) - 1
VAR rev = [Revenue]
VAR lyrev =
CALCULATE ( [Revenue], REMOVEFILTERS ( ‘Date (2)’ ), ‘Date (2)’[Year] = ly )
RETURN
IF ( OR ( ISBLANK ( rev ), ISBLANK ( lyrev ) ), BLANK (), rev - lyrev )
All year difference (finding min/max of all years and calculating the difference)
All Year Difference =
VAR revmin =
MINX ( VALUES ( ‘Date (2)’[FY] ), [Revenue] )
VAR revmax =
MAXX ( VALUES ( ‘Date (2)’[FY] ), [Revenue] )
VAR diff = revmax - revmin
RETURN
SWITCH ( TRUE (), ISINSCOPE ( ‘Date (2)’[FY] ), [Revenue], diff )
Thank you @datazoe for providing the Solution, this is exactly I was looking for, I have marked this as a solution, Thank you for your help