Vladas
November 16, 2018, 2:31pm
1
Hi,
Maybe someone could tell me where I made the mistake
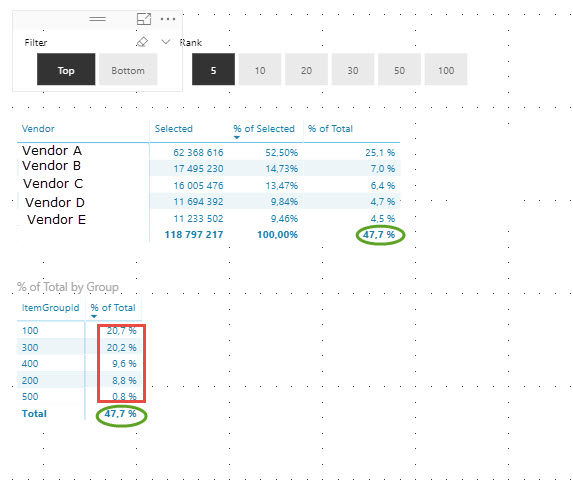
The problem is that it does not match the Total %.
Green - it’s correct
 % of Total =
DIVIDE ( [VendorFilter Selection];
    CALCULATE([Option Selection];ALLSELECTED('Item'))
    )
This will likely be to do with the RANKX formula you have I believe.
What is that? Can you add it here. And all other formula feeding into this.
You will have think a little bit about what the formulas are doing in the different context you have between these two tables.
For example, VENDOR looks to me to be different to ITEMGROUPID. So with these being different the actual formulas you have will work differently.
If you can add the formula you have that will be easier to assess.
Thanks
Vladas
November 19, 2018, 7:49am
3
Yes, you are right. Problem here could be with RANKX . But how can I change the context for this table by ItemGroupId ?
My RANKX formula:
Top Vendor by Rank =

VAR
	RankingDimension = VALUES( **'Item'[Vendorid]** )
VAR
	RankingSelect = [Rank Select]   ( f.eks. 5/10/20)
VAR
    RankDimSelected =[Option Selection]   (f. eks. Sales/Cost)

RETURN
CALCULATE( [Option Selection];
	FILTER( RankingDimension;
		RANKX( ALL( **'Item'[Vendorid]** ); [Option Selection]; ; DESC ) <= RankingSelect ) )
In this case I used Total Sales = Option Selection
Thanks
Well I think you have to realize here you probably need two different formula as you are ranking totally different things.
That’s what I believe by looking at this.
You probably need a brand new formula that uses ItemGroupID instead of VendorID.
That way you should get the correct results for the context in which you place the formula.
See how you go with this idea.
Sam
Vladas
November 21, 2018, 9:37am
5
Hi,
I’m stuck and I can’t find a solution. I’ve created a simpler model.
Problem:
I want to see filtered top vendors (green) by itemgroup
Data model: Measure Total Correction.xlsx (9.6 KB)
PBI : Sample File.pbix (51.7 KB)
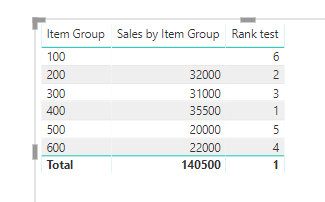
How about a pattern like this
Sales by Item Group =
VAR ItemRank = RANKX( ALL( Data[Item Group] ), [Total Sale], , DESC )
RETURN
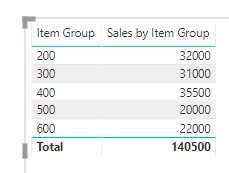
IF( HASONEFILTER( Data[Item Group] ),
IF( ItemRank <= 5, [Total Sale], BLANK() ),
SUMX( TOPN( 5, VALUES( Data[Item Group] ), [Total Sale], DESC ), [Total Sale] ) )
This ultimately gives you a dynamic table for the top x ranked items
You’ll have to add the SELECTEDVALUE in there
Thanks
Vladas
November 23, 2018, 1:15pm
7
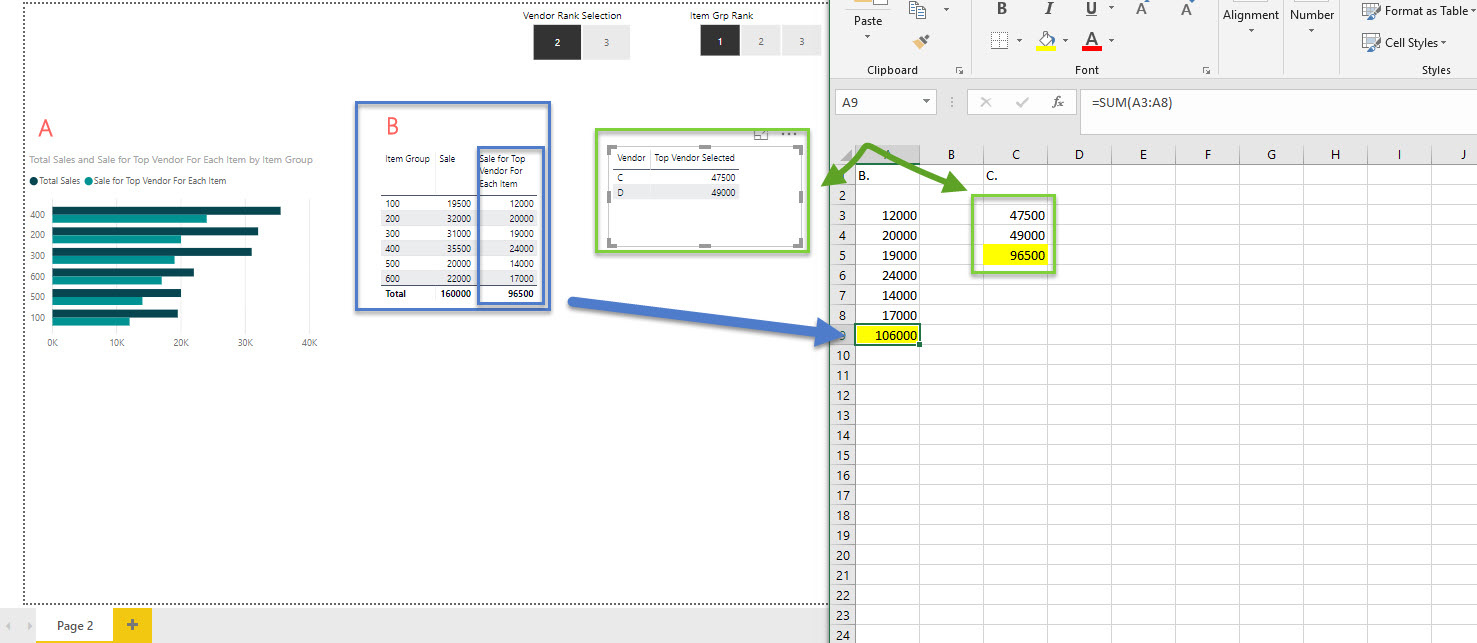
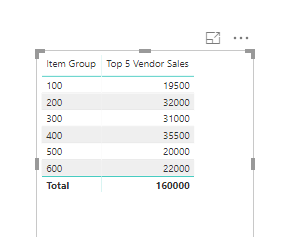
Hi Sam, thanks for answer, but I want to see f.eks “TOP 5 Vendors Sales” and how “TOP 5 Vendors Sales” is shared across all product groups (100,200,300,400,500,600).
At this moment I have problem in tabel B. TOP vendor sales are shown incorrectly by group, because I get a higher number of incomes than they really are.
f.eks. Tabel C. TOP2 Vendors = Total is 96500 but in Tabel B calc Total is 10600. How can I fix it ?
Context?Filters?RankX?
Thanks
Ok then how about this
Top 5 Vendor Sales =
CALCULATE( [Total Sale],
    TOPN( 5, VALUES( Data[Vendor] ), [Total Sale], DESC ) )
This is calculating the top 5 vendor sales per item.