Hi @dahlia.carroll:
You gave the example:
"params": [
	{"name": "max", "expr": "data('data_0')[0]['max']"},
	{"name": "min", "expr": "data('data_0')[0]['min']"}
]
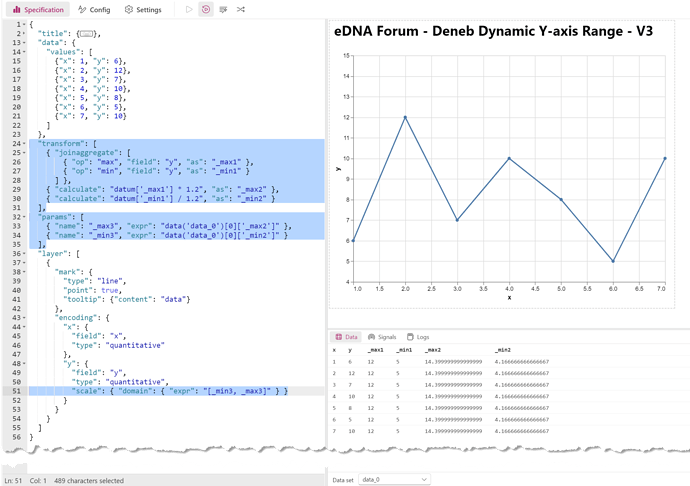
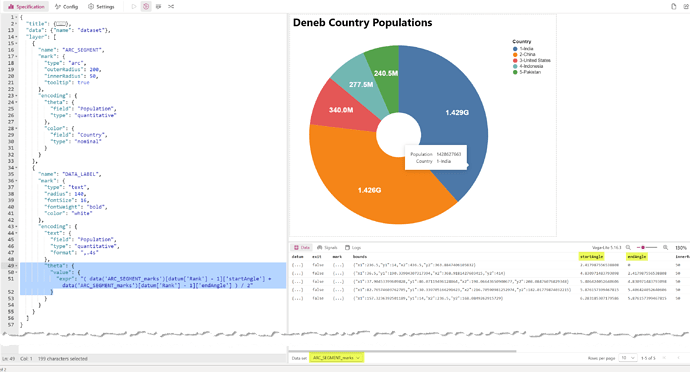
I’ve reviewed my notes and explored a bit and here’s my understanding:
data 	= the "data" function (allows access to all datasets)
data_0 	= the name of the desired dataset
0 		= the index of the desired row in the dataset's array (i.e., the accessor)
max 	= the name of the desired field from the referenced dataset
So, I stand corrected: you can use an expression in the scale domain.
I successfully used a mildly-modified version of the code you referenced from Davide Bacci which uses a “line” mark as a test case.
I also tried it out using an “arc” mark with a small dataset of the top 5 countries by population (2023) to confirm.
Please note that this is only my interpretation, and may not be correct. Hope it helps anyway.
Greg
eDNA Forum - Deneb Dynamic Y-axis Range - V3.pbix (1.5 MB)

