Hello. Welcome to another great workout. This is a 3-star workout.
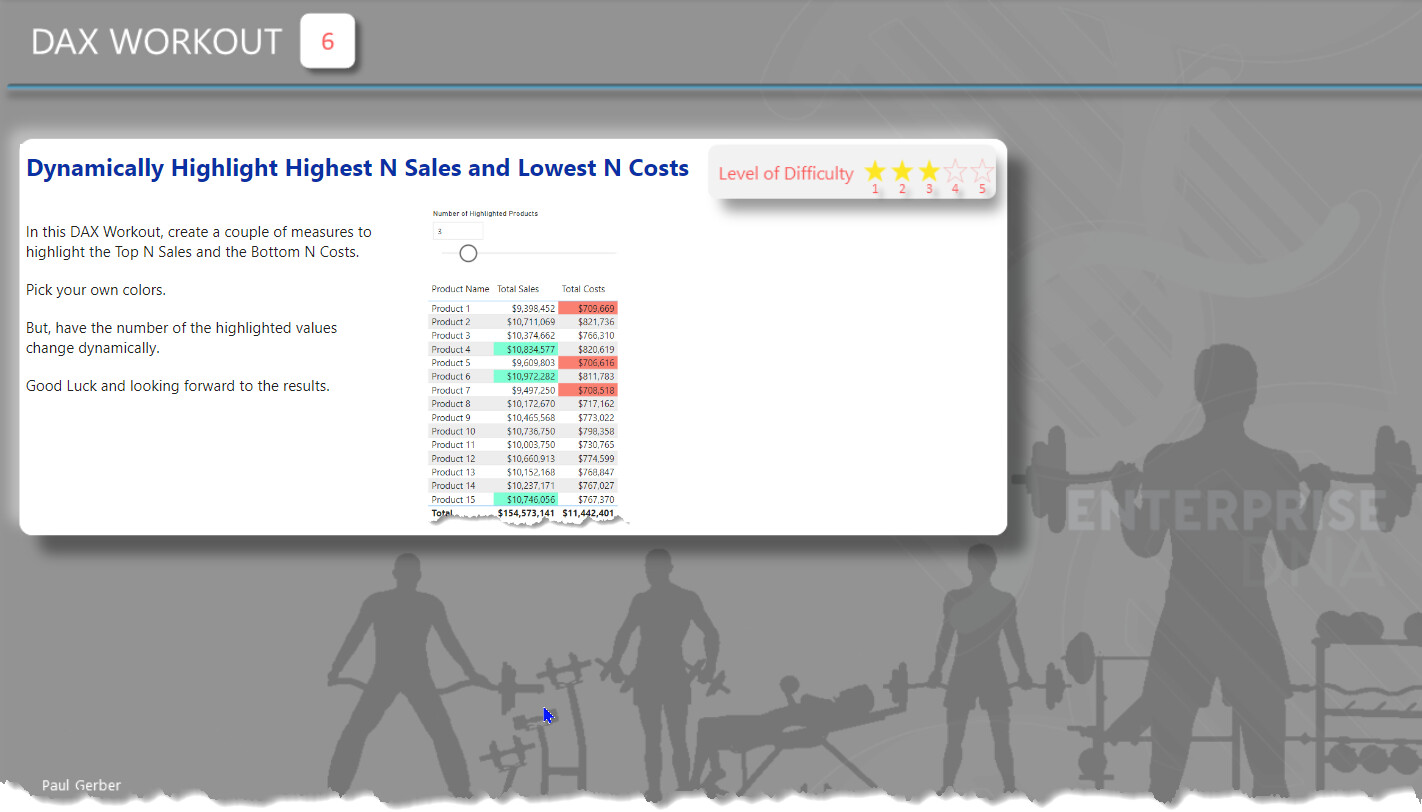
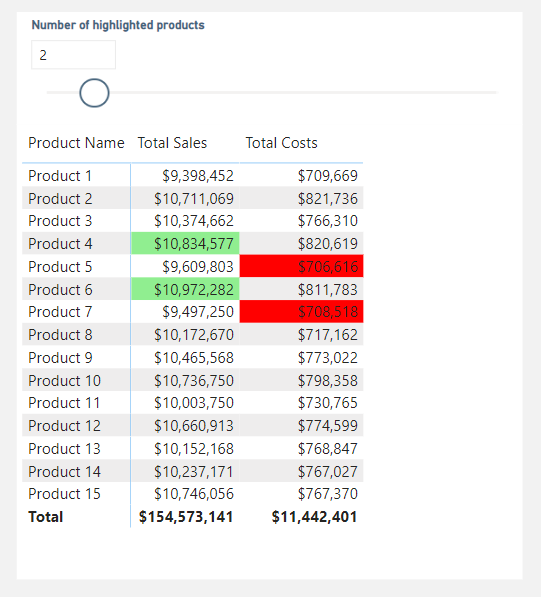
In the workout, you will need to create a couple of measures to highlight the Top N Sales and the Bottom N Costs.
Pick your own colors.
But, have the number of the highlighted values change dynamically.
Good luck and I am looking forward to the results.
Submission
Load the supplied data file into a new Power BI file, create your solution, and reply to this post. Upload a screenshot of your solution along with the DAX measure. Please format your DAX code and blur it or place it in a hidden section.
Period
DAX _6 Highlight Top Bottom N.pbix (553.4 KB)
2 Likes
BrianJ
April 6, 2023, 10:15pm
2
@Paul ,
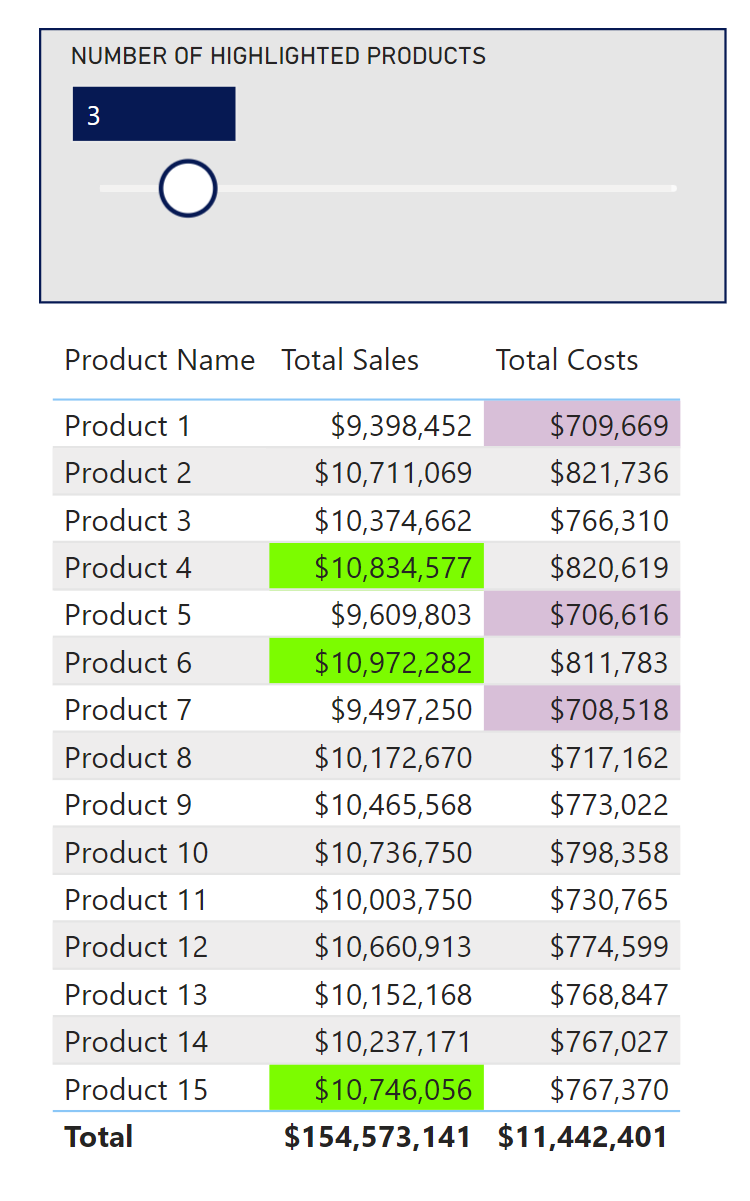
Great workout! Here’s my solution.
In honor of springtime in D.C., colors used were “LawnGreen” and “Thistle”.
Click for DAX Code
CF Total Sales =

VAR __vTable =

    TOPN(
        [Number of Highlighted Products Value],
        ALL(Products),
        [Total Sales],
        DESC
)

VAR __ProdCol =
SELECTCOLUMNS(__vTable, "@Prod", Products[Product Name] )

VAR __Result =
IF(
    SELECTEDVALUE( Products[Product Name] ) IN __ProdCol,
    "LawnGreen",
    BLANK()
)

RETURN __Result
CF Total Costs =

VAR __vTable =

    TOPN(
        [Number of Highlighted Products Value],
        ALL(Products),
        [Total Costs],
        ASC
)

VAR __ProdCol =
SELECTCOLUMNS(__vTable, "@Prod", Products[Product Name] )

VAR __Result =
IF(
    SELECTEDVALUE( Products[Product Name] ) IN __ProdCol,
    "Thistle",
    BLANK()
)

RETURN __Result
4 Likes
@BrianJ awesome job!! Yes they are fitting colors for DC springtime.
Anurag
April 7, 2023, 2:58am
4
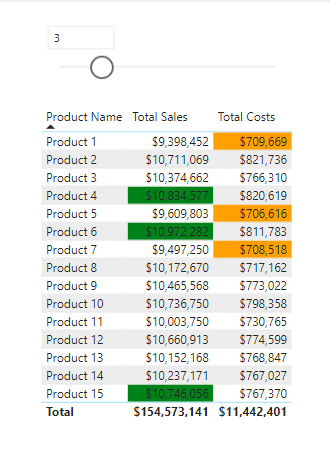
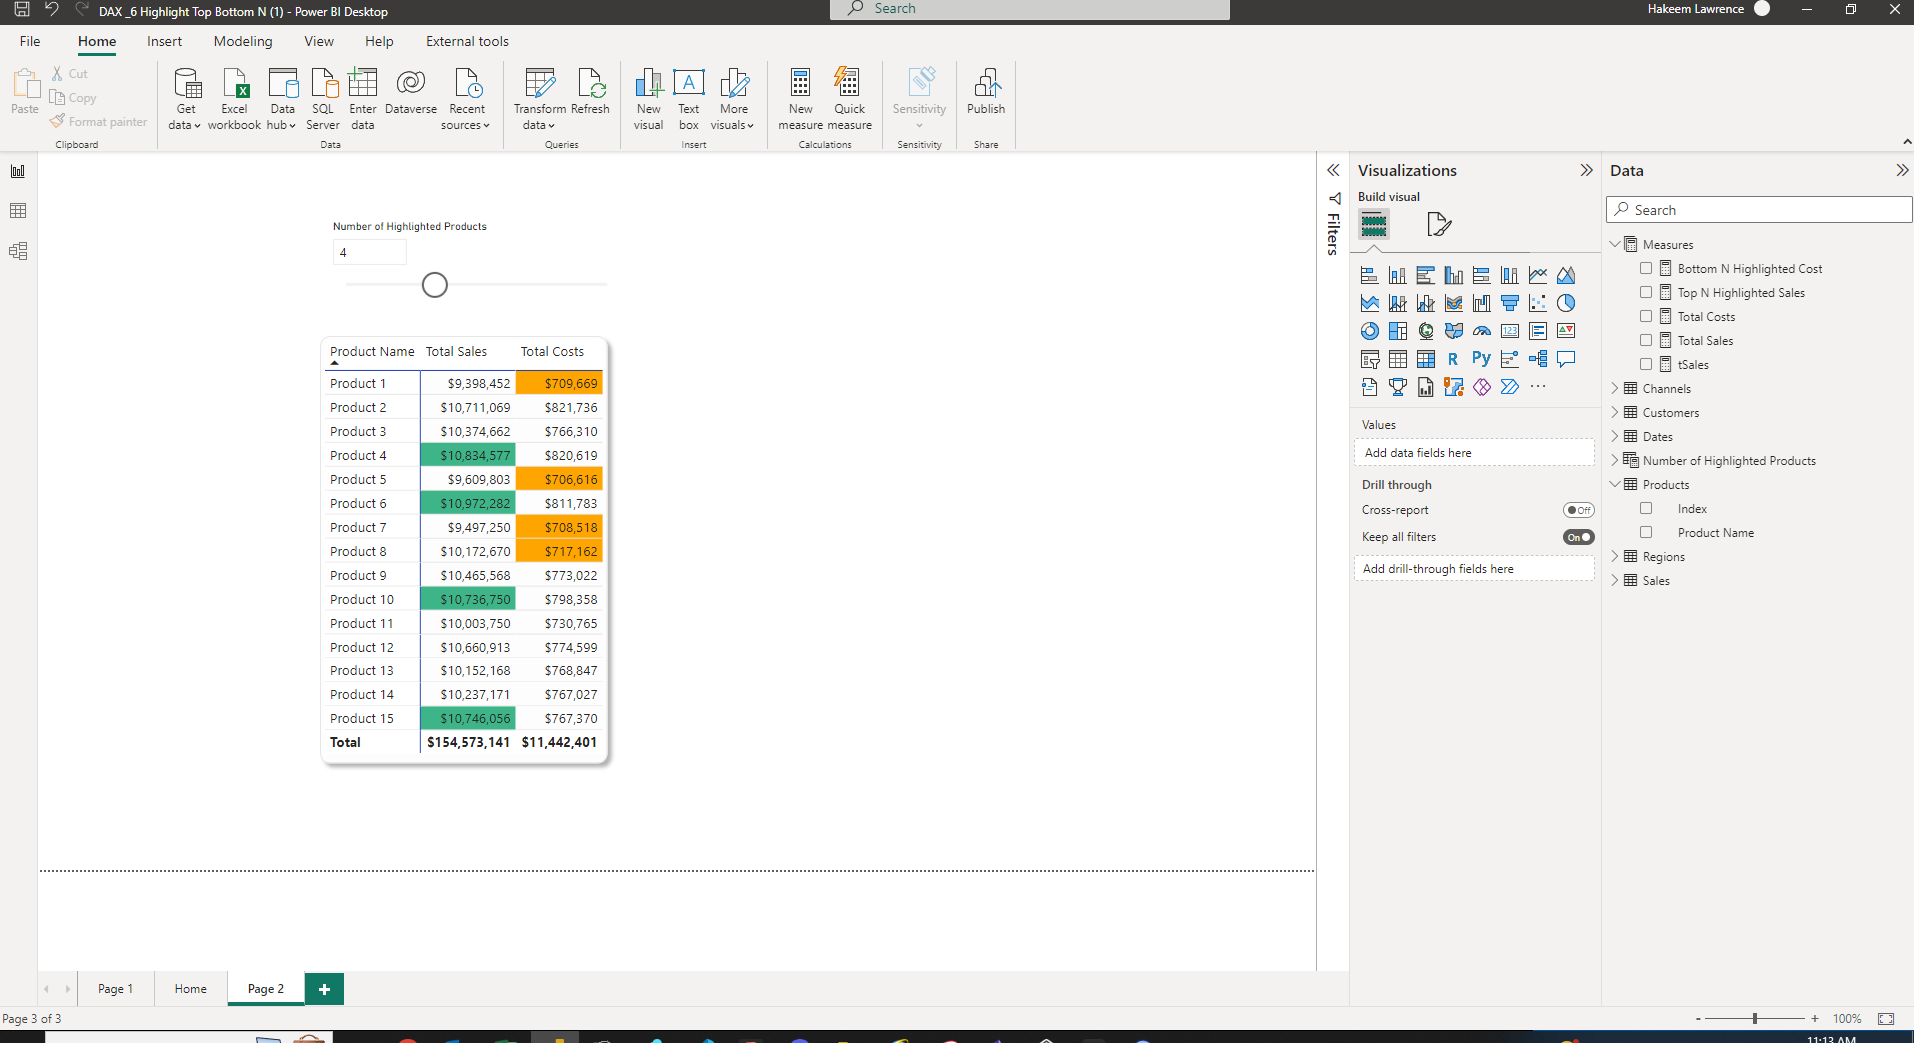
Hi ,
Here is my submission for the workout
DAX CODE
TopSale =
VAR _val=[Parameter Value]
VAR tb =
    TOPN ( _val, ALL ( Products ), [Total Sales] )
RETURN
    IF (
        COUNTROWS (
            FILTER ( tb, [Product Name] = SELECTEDVALUE ( Products[Product Name] ) )
        ) > 0,
        "GREEN"
    )

BottomCost =
VAR _val=[Parameter Value]
VAR tb =
    TOPN ( _val, ALL ( Products ), [Total Costs], ASC )
RETURN
    IF (
        COUNTROWS (
            FILTER ( tb, [Product Name] = SELECTEDVALUE ( Products[Product Name] ) )
        ) > 0,
        "Orange"
    )
DAX _6 Highlight Top Bottom N.pbix (559.1 KB)
Thanks
2 Likes
mbraun
April 7, 2023, 3:30pm
6
Love these one off DAX. Here is my entry. You can see on the “Main” tab the table and highlighting and then on the Methodology tab I walked through how I accomplished it.
DAX Workout No6 MB.pbix (1.2 MB)
2 Likes
Eze
April 8, 2023, 3:44pm
7
Here is my submission, the more I go through other solutions, the more I learn. Thanks all
DAX Code
TopNSales =
VAR _Number = SELECTEDVALUE(‘Number of Metrics’[Number of Metrics])
VAR _Ranking = RANKX(ALL(Products),[Total Sales],DESC)
VAR _TopN = IF (_Ranking <= _Number,[Total Sales],BLANK())
VAR _Result = IF ([Total Sales] = _TopN, “lightGreen”)
_Result
BottomNCosts =
VAR _Number = SELECTEDVALUE(‘Number of Metrics’[Number of Metrics])
VAR _Ranking = RANKX(ALL(Products),[Total Costs],ASC)
VAR _BottomN = IF (_Ranking <= _Number,[Total Costs],BLANK())
VAR _Result = IF ([Total Costs] = _BottomN, “Salmon”)
_Result
2 Likes
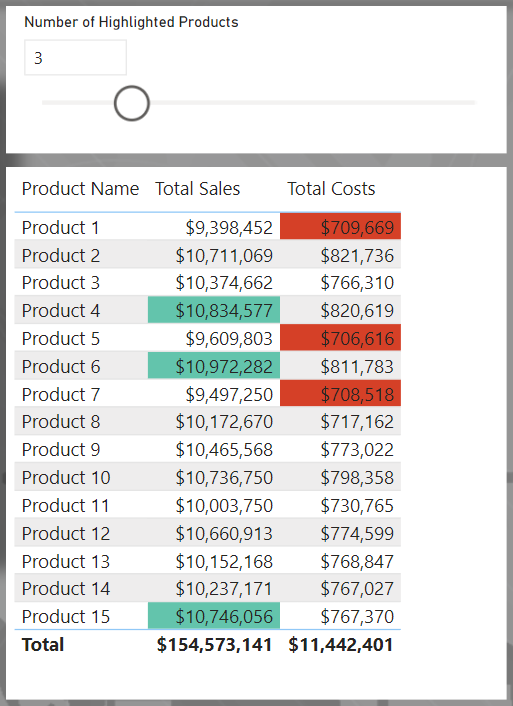
I picked colorblind safe red and green.
DAX _6 AlexisOlson.pbix (556.7 KB)
Top N Sales
Solution using TOPN:
Color Top N Sales =
VAR _N = [N] /*From parameter slicer*/
VAR _CurrProduct = SELECTEDVALUE ( Products[Index] )
VAR _AllSales_ =
    ADDCOLUMNS (
        ALLSELECTED ( Products ),
        "@Sales", [Total Sales]
    )
VAR _TopProducts_ =
    SELECTCOLUMNS (
        TOPN ( _N, _AllSales_, [@Sales] ),
        Products[Index] /*Return only this column*/
    )
VAR _Result =
    IF ( _CurrProduct IN _TopProducts_, "#57c4ad" )
RETURN
    _Result
Bottom N Cost
Solution using RANKX:
Color Bottom N Costs =
VAR _N = [N] /*From parameter slicer*/
VAR _Rank = RANKX ( ALLSELECTED ( Products ), [Total Costs], , ASC )
VAR _Result = IF ( _Rank <= _N, "#db4325" )
RETURN
    _Result
4 Likes
BrianJ
April 8, 2023, 8:07pm
9
@AlexisOlson ,
Great to see you here! Really like the way you took one approach for the top products and a different approach for the bottom products.
Also, great point about making colors colorblind accessible.
1 Like
Hi All,
Here are the steps I used for this workout:
Highlight Top N Sales
Highlight Top N Sales =
var _SalesRanking =
        RANKX(
            ALLSELECTED(Products),
            [Total Sales],
            ,
            DESC
        )
var _SalesHiglight = [Number of Highlighted Products Value]
var _Result =
        SWITCH(
            TRUE(),
            _SalesRanking <= _SalesHiglight, "#A9D18E"
        )
return
_Result
Another measure to define color for bottom N Costs based on slicer:
Highlight Bottom N Costs
Highlight Bottom N Costs =
var _BottomCostRanking =
        RANKX(
            ALLSELECTED(Products),
            [Total Costs],
            ,
            ASC
        )
var _SalesHiglight = [Number of Highlighted Products Value]
var _Result =
        SWITCH(
            TRUE(),
            _BottomCostRanking <= _SalesHiglight, "#8FAADC"
        )
return
_Result
Apply conditional formatting in Total Sales, background color, field value, Highlight Top N Sales
Apply conditional formatting in Total Costs, background color, field value, Highlight Bottom N Costs
3 Likes
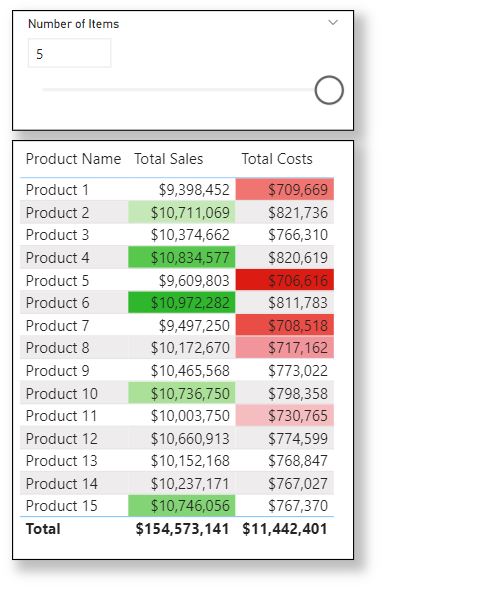
Definitely enjoyed this one. And I wanted to take it a bit further by adding in a gradient of the colors. So you can see that the top sales has the darker green, but there is a slight gradient for others.
My Approach
Create the Numeric Parameter from 1 to 5 and used as a slicer.
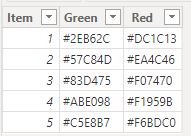
Created a table of 5 items which included a Item #, and then a column each for my green and red colors that would be used for the gradient.
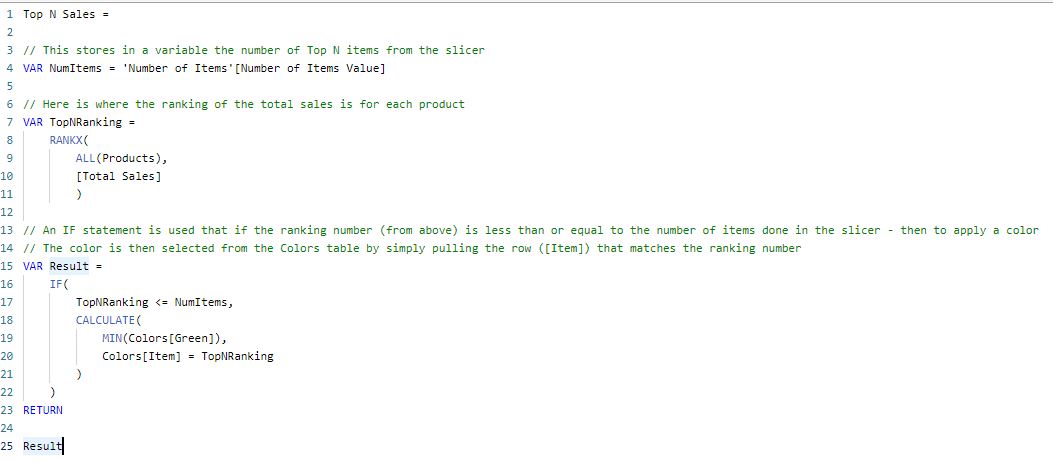
Created a measure for the Top N Sales (to be done in Green)
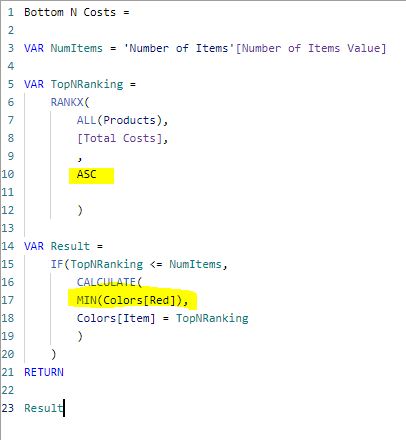
Created a second measure for the Bottom N Sales (to be done in Red) - this is exactly the same as above with the exception that changes the order for the RANKX function (highlighted areas).
And this results in the outcome. I’m showing 5 items so you can see the gradient.
5 Likes
Dharma
April 9, 2023, 2:27pm
12
@Paul.Gerber
Here is my Submission
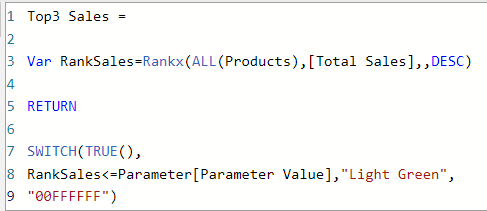
TopNSales =
VAR _SelectedRank = SELECTEDVALUE(Parameter[Number of Highlighted Values])
VAR _TopNSales = RANKX(ALL(Products), [Total Sales], ,DESC)
VAR _Condition = IF(_TopNSales<=_SelectedRank, “Light Green”)
Return
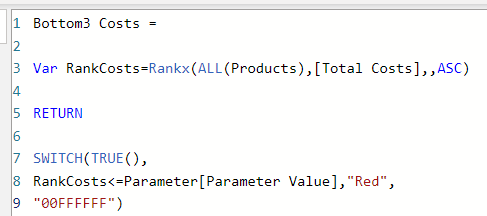
BottomNCost =
VAR _SelectedRank = SELECTEDVALUE(Parameter[Number of Highlighted Values])
VAR _TopNSales = RANKX(ALL(Products), [Total Sales], ,ASC)
VAR _Condition = IF(_TopNSales<=_SelectedRank, “Coral”)
ReturnDAX _6 Highlight Top Bottom N.pbix (562.7 KB)
3 Likes
KimC
April 10, 2023, 7:31am
13
Hi Paul,
Thanks for the workout. A bit late but here is my solution:
Summary
2 Likes
Awesome work @scancela.90 Thank you for participating
1 Like
@tweinzapfel I love it. I like the variation in colors and just limiting it to 5. Great job
Really great work @AlexisOlson
Keep going @Eze Good job!
Hakeem
April 11, 2023, 3:16pm
20
Top N Highlighted Sales =

var selectedVal = 'Number of Highlighted Products'[Number of Highlighted Products Value] -- selected number

var topProducts = TOPN(selectedVal, ALL(Products), [Total Sales], DESC)  -- list of top products

var totalSales = CALCULATE([Total Sales],
                        KEEPFILTERS(topProducts)
)

var result = IF(
                 totalSales = [Total Sales],
                 "#3eb489")
return

result


Bottom N Highlighted Cost =

var selectedVal = 'Number of Highlighted Products'[Number of Highlighted Products Value] -- selected number

var bottomProducts = TOPN(selectedVal, ALL(Products), [Total Costs], ASC)  -- list of bottom products

var totalCost = CALCULATE([Total Costs],
                        KEEPFILTERS(bottomProducts)
)

var result = IF(
                 totalCost = [Total Costs],
                 "orange")
return

result
2 Likes