During a recent workshop I can across a problem that required fixing.
After some additional testing I understood why and it makes a lot of sense.
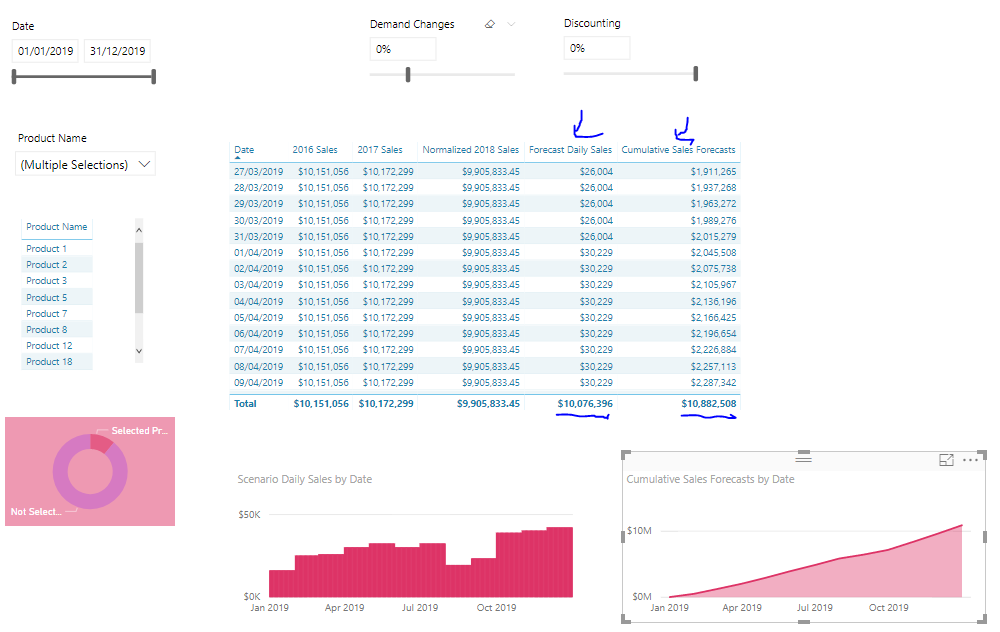
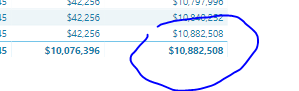
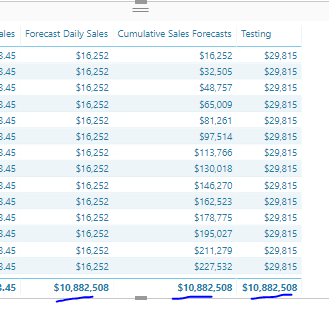
The two totals here are not the same and they should be
There’s a bit too these formulas but will add them here for review
Forecast Daily Sales =
VAR AverageSales = DIVIDE( [2016 Sales] + [2017 Sales] + [Normalized 2018 Sales], 3 )
VAR SeasonalityPercent = CALCULATE( AVERAGE( Seasonality[Seasonality Percent] ), TREATAS( VALUES( Dates[Short Month] ), Seasonality[Months] ) )
VAR DailyAllocation = DIVIDE( 1, CALCULATE( COUNTROWS( Dates ), ALL( Dates ), VALUES( Dates[Month & Year] ) ), 0 )
VAR DaysIn2019 = COUNTROWS( FILTER( ALL( Dates ), Dates[Year] = "2019" ) )

RETURN
IF( HASONEVALUE( Dates[Date] ),
    AverageSales * SeasonalityPercent * DailyAllocation,
        AverageSales * DIVIDE( COUNTROWS( Dates ), DaysIn2019 ) )
And then the current cumulative total formula.
Cumulative Sales Forecasts =
CALCULATE(
    SUMX( SUMMARIZE( Dates, Dates[Date], "Daily Sales", [Forecast Daily Sales] ), [Daily Sales] ),
        FILTER( ALLSELECTED( Dates ),
            Dates[Date] <= MAX( Dates[Date] ) ) )
The issue could have been from a number of places so I did what I always like to do and break things down piece by piece.
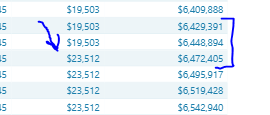
To me the cumulative total looks ok due to the last result being the same as the total
It also seems to be accumulating the results correctly as you can see below. It’s picking up the seasonality in the calculation which is promising.
So why are the totals not same?
After focussing right on the total I realized the issue.
It actually wasn’t taking into account the increase in sales that was being forecasted via the seasonality table. We were forecasting an increase in sales of 8% overall and this particular total wasn’t taking it into account, eventhough the individual values were
So I had to add a simple SUM to the end of the formula, see below
Forecast Daily Sales =
VAR AverageSales = DIVIDE( [2016 Sales] + [2017 Sales] + [Normalized 2018 Sales], 3 )
VAR SeasonalityPercent = CALCULATE( AVERAGE( Seasonality[Seasonality Percent] ), TREATAS( VALUES( Dates[Short Month] ), Seasonality[Months] ) )
VAR DailyAllocation = DIVIDE( 1, CALCULATE( COUNTROWS( Dates ), ALL( Dates ), VALUES( Dates[Month & Year] ) ), 0 )
VAR DaysIn2019 = COUNTROWS( FILTER( ALL( Dates ), Dates[Year] = "2019" ) )

RETURN
IF( HASONEVALUE( Dates[Date] ),
    AverageSales * SeasonalityPercent * DailyAllocation,
        AverageSales * DIVIDE( COUNTROWS( Dates ), DaysIn2019 ) * SUM( Seasonality[Seasonality Percent] ) )
And do the same for the other formulas also.
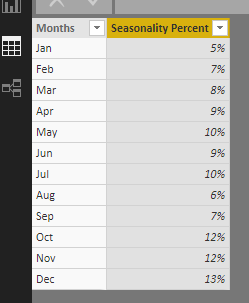
Here’s the seasonality table for review. All these percentages add up to 108% as I baked in the growth to our forecasted results within this table.
New results here to show that it works out.
Will update the replay link with the updated resource.
Chrs!
Sam