DAX or Modeling (or maybe both)

Hi DNA forum,

I continue my exploration PBI. I’m still stuck in what I con
Sample_Sales_Period.pbix (81.5 KB)
Simple_Sales_Sample.xlsx (19.7 KB)
sider basic stuff (but not so basic to me :slight_smile: )

I want to add a budget total (either directly from the model or as a measure (I thin could be done without a measure but maybe Im wrong)

the budget is calculated by Unit, Category (account) and period.

Can this be done without DAX, or I need a measure? In the case I need a measure is it a simple calculate table? Do I Need FILTER (maybe by Account ?)

I have attached pbix and excel datasource.

Thanks a lot for your advice and potential solution

J.Rafael

  1. List item

@JR_PBI ,

Unfortunately, DAX isn’t an option here because the underlying model is so fatally flawed that it will never produce reliable results, even if your DAX code is perfect.

In addition, the Budget Period table has a bunch of leading blank rows that must be removed as not to cause problems in the data modeling phase.

Finally, for any time intelligence-based analysis such as budgeting, you need a proper Date Table appropriate marked as such and your current Periods table violates a number of the conditions of a proper Date Table.

So, that’s the bad news. The good news is that all of these topics are well covered in the following courses. My recommendation would be to work through both of these courses in detail, rework your data model and resolve the issues cited above. If you still have questions or problems after you’ve worked through those materials and attempted an overhaul of your existing model just give a shout back to the forum attaching a copy of you work in progress PBIX file. Here are the courses to work through:

I hope this is helpful.

  • Brian
2 Likes

Thanks for your answer.

Actually, without the Budget column all other measures and data work fine. I did it with the help of another forum user who show me how to create the two measures in the matrix (which are filtering properly. I know I dont have a Date Table, but the periods table with the BeginDate field allows for the measures to use PBI Date functions.

I thought I could use the same approach for the budget column.

At the moment it seems to pick up the budget (by unit and period), but it looks as if not being filtered by account. Thus giving a repeating value. It picks up the 3 records below and returns it sum for every line.
The objective is to pickup only the corresponding account_no (which is part of the category)

|Unit|Period|Account_No|Budget|
|WAS|202108|40000-100|1000|
|WAS|202108|40000-110|1200|
|WAS|202108|40000-120|950|

Anyway thanks for answering, I will keep trying and check the videos to see if I get a hint. I think Im not far a away from a suitable solution that could work with the current tables.

If you have any other ideas, by all means reply.

Thanks

J. Rafael

@JR_PBI

I took at look at your model as I was going to try to assist after I get off work. But I have to agree with @BrianJ here, this report needs work.

  1. Not having a real date table is going to be a serious problem for you. You have two Time Intelligence functions, and to ensure that these always work correctly PowerBI HAS to have a full Date table. Because you didn’t provide one, the program has created one for you, and it’s bloating your model. Note the image below - the two red boxes show tables that were added to make your YTD Sales and SPLY Sales data work.

image

  1. All of the blank rows in your Budget_Period table are taking up space that you don’t need to give up in your model, and as mentioned above, can cause issues down the road.

  2. It’s going to be pretty hard for your account info to filter your budget - take a look at the number values (hint, there’s an extra 0)
    image

But, that is not what is creating your repeating values with the Budget information - you don’t have the Account information anywhere in the visual, so that can’t be the problem you are seeing.
The repeating value is because you are using the Period from the Periods table in the “PeriodStr” filter on the right side of the report - and you are using the Period from the Sales table on the matrix in the center of the screen.

My suggestion, if you’re not going to accept the help of one of our forum experts - go through the Ultimate Beginners Guide to DAX ASAP. :slight_smile:

3 Likes

Thanks Heather,

Actually, I’m taking the advice from Brian (and checking the videos).

I just thought I could get some feedback while I keep learning.

Really interesting the stuff you mentioned about tables create in the background by PBI.

So the first two things I did were to correct the data source tables (these contain fictitious data that I’m creating as I go). So I cleaned the empty rows (as per Brian), and I fixed the mistake I made in the account_no (as you advice me, thanks. I missed that one)

As soon as I fixed the account_No, values starting to appear in the column (budget). So if I select a period, it brings the right budget for (Unit, Period, Account) and it does that for the matrix line that contains the period.

But I’m not sure that the Total Budget Period MEASURE is right (even though the value is correct), cause I’m using a MAX function (I was not able to make it work otherwise, … learning curve).

Thanks for you advice. The report (learning report or proof of concept) is looking like this:

Im going to check the model and then I will start from the beginning with the videos to figure out what Im doing wrong! :slight_smile: even though Im familiar with SQL and Python I have to get me into the PBI Mindset!

Thanks a million for your feedback

Just in case here are the new files:
Sample_Sales_Period.pbix (108.7 KB)
Simple_Sales_Sample.xlsx (19.5 KB)

@JR_PBI

I had some time this morning, and decided to tackle this a bit.

I did some cleanup of your model (based on what I THINK I understand of your data and how it should relate), it is possible that you are going to need to do something that I didn’t know about, so you may need a column or relationship that I got rid of.

I did add a calendar table - removing your period table, as any other dates in your model will add their own separate phantom date table. And when I did this, I turned OFF the Auto Date/Time setting in the options for this report.
Congratulations - your report is now fully outfitted with the wonderful Extended Date Table from @Melissa : Extended Date Table (Power Query M function)

I like to hide any columns that are used in a relationship (so that you can’t accidentally pull in the wrong period column to use in a slicer or table visual). So I did that with all your tables (just select view hidden from the right-click menu in the fields pane to see everything).

And I changed your visual and filters around to use the primary tables instead of the data tables.
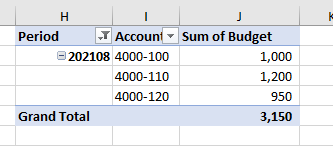
I’m not sure how your “Total Budget Period” measure is working properly - because I don’t see 1200 as the result when I create a pivot table from your budget table and filter it down to August 2021.
So you may want to take a look at that in your model.

image

attached is the file I worked on this morning, hopefully it will help you to get moving in the right direction.
eDNA file - Sample Sales.pbix (152.4 KB)

2 Likes

WOW! Heather!

Thanks a lot for taking the time and effort to give me feedback!

  1. Thanks for the date table link.

  2. I can see the way you are using the “Same Period Last Year” function, instead of what I was calculating with dateadd and the period. So I got feedback on the usage of the date table.

  3. I can see that I need to get a stronger understanding in terms of MODELING. Because it seems there is a direct correlation in how you link the tables and the actual visuals you have in the report. So I need to read on PBI modeling. My SQL knowledge does not help all the time.

IF we take a look at both reports, at the highest level they are very close:

You:

Me:
image

Therefore I have a good reference point and I can continue my exploration process.

I really appreciate your feedback! Thanks a lot!

Ralph

2 Likes

always happy to help - down the road your SQL knowledge will probably help you ‘get’ things sooner than other new learners, but the foundations of modeling and building the measures and visuals does require a different way of thinking. :slight_smile:

Good luck with your PowerBi journey!

1 Like

Thank you so much for the very detailed answer @Heather :slight_smile:

Hello @JR_PBI, if the inquiry was answered kindly mark the response that you think best helped you.

Kindly take time to answer the Enterprise DNA Forum User Experience Survey too.

Thank you so much.

Hi @JR_PBI, we’ve noticed that no response has been received from you since September 25. We just want to check if you still need further help with this post? In case there won’t be any activity on it in the next few days, we’ll be tagging this post as Solved.