Hi @Luukv93,
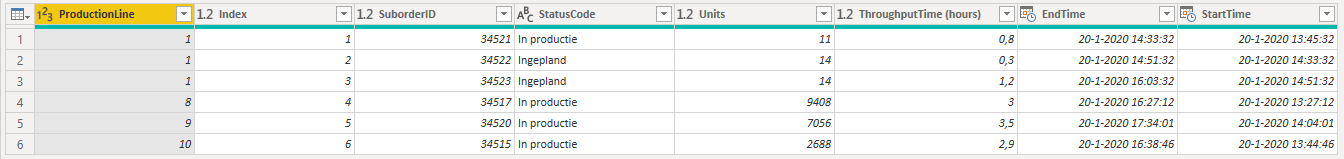
I have a Power Query solution for you, where each row now has a StartTime and EndTime see below.
These are the main steps:
- Calculated the EndTime for all lines containing a StartTime
- Duplicated the EndTime and that Filled them Down
- Calculated the EndTime for the Planned Production
- Calculated the StartTime for all Planned Production lines
.
And this is the full M code:
let
    Source = data,
    #"Sorted Rows" = Table.Sort(Source,{{"Index", Order.Ascending}}),
    #"Renamed Columns" = Table.RenameColumns(#"Sorted Rows",{{"StartTime", "StartTime1"}}),
    #"EndDate in Production" = Table.AddColumn(#"Renamed Columns", "EndDate In Production", each if [StartTime1] <> null then [StartTime1] + #duration(0,0,([#"ThroughputTime (hours)"]*60),0) else null, type datetime),
    #"Duplicated EndDate" = Table.DuplicateColumn(#"EndDate in Production", "EndDate In Production", "FilledEndDate"),
    #"Filled Down EndDate" = Table.FillDown(#"Duplicated EndDate",{"FilledEndDate"}),
    TableGroup = Table.Group(#"Filled Down EndDate", {"ProductionLine"}, {{"All Rows", each _, type table [Index=number, ProductionLine=number, SuborderID=number, StatusCode=text, StartTime1=datetime, Units=number, #"ThroughputTime (hours)"=number, EndDate In Production=datetime, FilledEndDate=datetime]}}),
    #"Added Calc" = Table.AddColumn(TableGroup, "Calc", each Table.Skip ([All Rows], 1), type table),
    #"Expanded All Rows" = Table.ExpandTableColumn(#"Added Calc", "All Rows", {"Index", "SuborderID", "StatusCode", "StartTime1", "Units", "ThroughputTime (hours)", "EndDate In Production", "FilledEndDate"}, {"Index", "SuborderID", "StatusCode", "StartTime1", "Units", "ThroughputTime (hours)", "EndDate In Production", "FilledEndDate"}),
    #"Added EndTime" = Table.AddColumn(#"Expanded All Rows", "EndTime", each if [EndDate In Production] <> null then [EndDate In Production] else #duration(0,0, (List.Sum( Table.SelectRows( [Calc], (i) => i[Index] <= Number.From([Index]))[#"ThroughputTime (hours)"])*60 ),0) + [FilledEndDate], type datetime),
    #"Grouped Rows" = Table.Group(#"Added EndTime", {"ProductionLine"}, {{"All Rows", each _, type table [ProductionLine=number, Index=number, SuborderID=number, StatusCode=text, StartTime=datetime, Units=number, #"ThroughputTime (hours)"=number, EndDate In Production=datetime, FilledEndDate=datetime, Calc=table, EndTime=datetime]}}),
    #"Duplicated Column" = Table.DuplicateColumn(#"Grouped Rows", "All Rows", "All Rows 2"),
    #"Expanded All Rows1" = Table.ExpandTableColumn(#"Duplicated Column", "All Rows 2", {"Index", "SuborderID", "StatusCode", "StartTime1", "Units", "ThroughputTime (hours)", "EndTime"}, {"Index", "SuborderID", "StatusCode", "StartTime1", "Units", "ThroughputTime (hours)", "EndTime"}),
    #"Added Custom" = Table.AddColumn(#"Expanded All Rows1", "StartTime", each if List.IsEmpty(Table.SelectRows([All Rows], (i) => i[Index] = [Index]-1)[EndTime]) then [StartTime1] else Table.SelectRows([All Rows], (i) => i[Index] = [Index]-1)[EndTime]{0}, type datetime ),
    #"Removed Other Columns" = Table.SelectColumns(#"Added Custom",{"ProductionLine", "Index", "SuborderID", "StatusCode", "Units", "ThroughputTime (hours)", "EndTime", "StartTime"})
in
    #"Removed Other Columns"
.
I hope this is helpful.
eDNA - calc End and StartTime PQ.pbix (13.3 KB)