DATEADD within SUMX returning 0 or blank

Hi team!

I am working on a department level breakdown on productivity improvements MoM for a series of hospitality properties. What I am trying to accomplish is to find the difference in this month’s productivity compared to last month for each department, then aggregate up all of those ‘deltas’ into an aggregated ‘delta’ for the property each month.

Here’s my issue
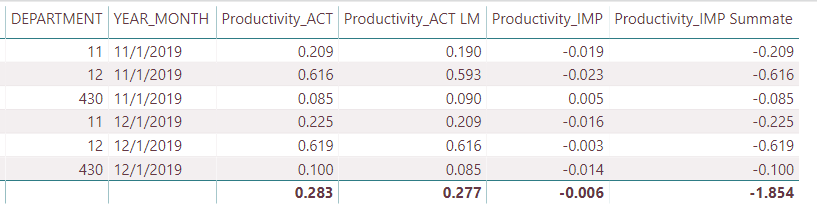
I want DAX to calculate a delta for every month and department (the lowest levels of my data) but whenever I nest the DATEADD function into a SUMX, DAX returns 0 or blank for the values for ‘Last Month’.

Here is a quick snapshot of my output table

My formulas:
Productivity_ACT LM =
DIVIDE(
CALCULATE( [Hours_Total_ACT], DATEADD( ‘1_0_Savings Table’[YEAR_MONTH], -1, MONTH ) ) ,
CALCULATE( [Volume_ACT], DATEADD( ‘1_0_Savings Table’[YEAR_MONTH], -1, MONTH ) )
, 0
)

Productivity_IMP =
CALCULATE(
[Productivity_ACT LM] - [Productivity_ACT],
‘1_0_Savings Table’[Active Status] = “ACTIVE” )

Productivity_IMP Summate =
SUMX( ‘1_0_Savings Table’,
CALCULATE(
[Productivity_ACT LM] - [Productivity_ACT],
‘1_0_Savings Table’[Active Status] = “ACTIVE” ) )

Hi,

Would it be possible to share your PBIX file.

Regards,
H

@lfPBI,

Welcome to the forum! Glad to have you here.

@haroonali1000 is spot on - posting your PBIX file is the best way to get a specific, detailed response on the forum.

Two things in general that may be a big help to diagnosing the problem here is to break your measures down by components, using measure branching and/or variables. That way you can isolate exactly where the problem is occurring.

I hope this is helpful.

  • Brian
1 Like

@haroonali1000 @BrianJ

Weekly Dashboards - SAMPLE.pbix (1.7 MB)

Have uploaded a sample file from the data sources, can’t share entire thing but can see the productivity calculations I’m trying to make can be found in the “Sample Measures” table

@lfPBI,

Perfect, thanks – posting a sample is fine.

@haroonali1000 since you were the first one to respond, do you want to work this solution? (kind of like calling a fly ball in the air - I just want to make sure we’re not duplicating each other’s efforts).

  • Brian

@lfPBI,

OK, I think I got this worked out. Here’s what I did:

  • Marked your date table as a date table, and validated on the date field. (ensures that time intelligence functions will work properly)

  • Simplified your Hours Act and Volume Act measures (since these are simple column sums, you can just use SUM() instead of SUMX() )

  • Then, using measure branching, created LM versions of the revised measures above using DATEADD(). Here’s one of those measures:

    Hours Tot Act LM =

      CALCULATE(
          [Hours_Total_ACT],
          DATEADD(
              '3_0_Date Table'[Date],
              -1,
              MONTH
          )
      )
    

This then further simplifies the measures using SUMX() to get the correct totals:

Productivity_ACT LM = 

VAR QuotientLM =
DIVIDE( [Hours Tot Act LM] , [Volume Act LM] , 0 )

RETURN
SUMX(
    SUMMARIZE(
        '1_0_Savings Table',
        '1_0_Savings Table'[OPERATINGUNIT],
        '1_0_Savings Table'[DEPARTMENT]
    ),
    QuotientLM
)

Here it is all put together:

You were very much on the right track, but measure branching and use of variables make these sorts of DAX debugging efforts much simpler and clearer.

I hope this is helpful. Full solution file posted below.

4 Likes

@BrianJ thank you! this is exactly what I was looking for

@lfPBI,

Excellent – glad I could help.

  • Brian