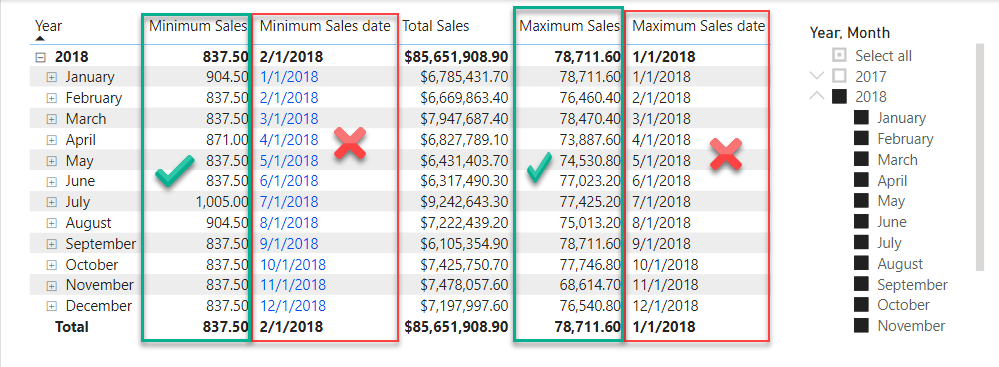
These are measures that I used in the Masterclass Demo Model.pbix. I think It is a hierarchy context level issue .
– Find the minimum sales on a daily basis
We can definitely work through the DAX-only solution if you’d like, but with a little prep work in Power Query, it makes the DAX a complete breeze here.
In Power Query:
do a merge to pull MonthnYear into your Sales table from your Date table
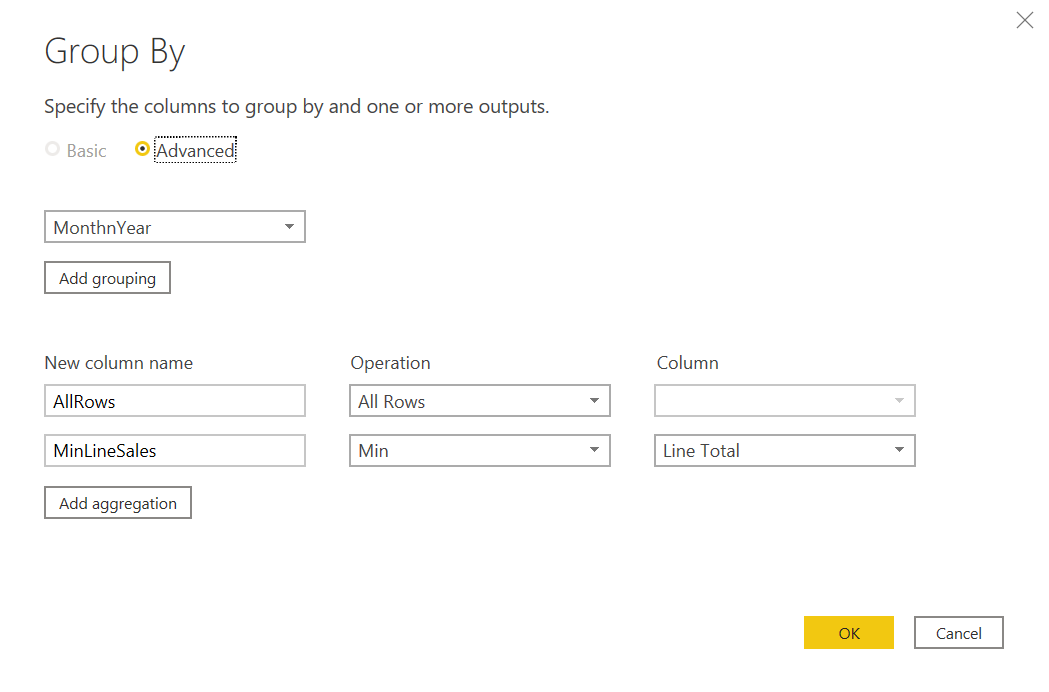
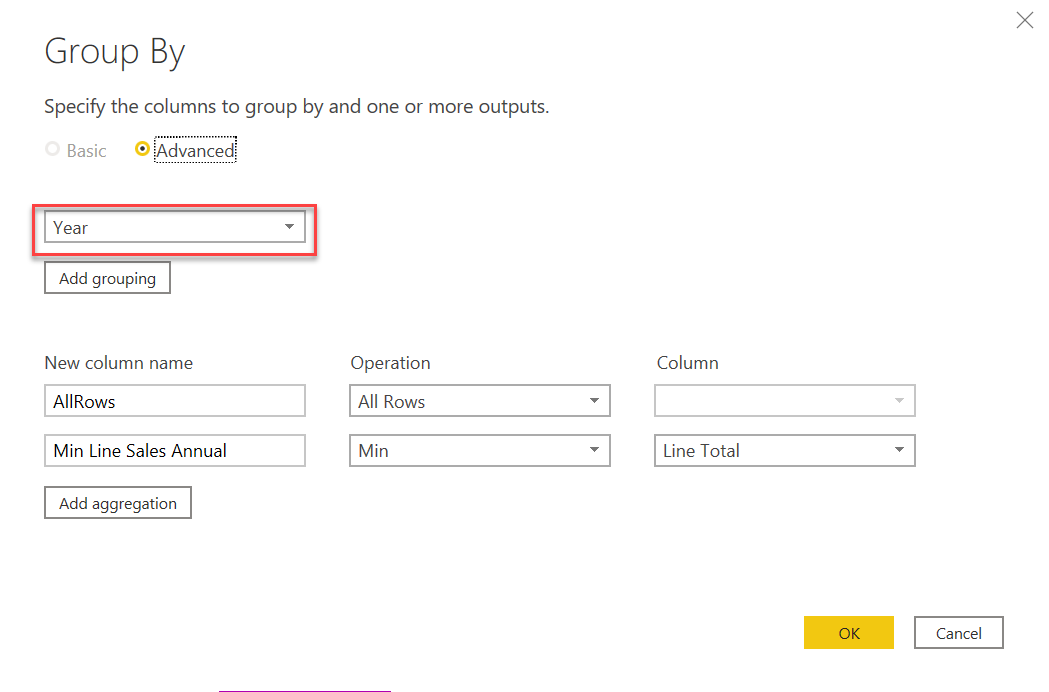
now group your data on the MonthnYear we just pulled in above to identify the min line sales per month:
When you get used to this grouping approach, you will find a multitude of applications for it, and in many cases it will take a very complex solution and make it really simple and straightforward.
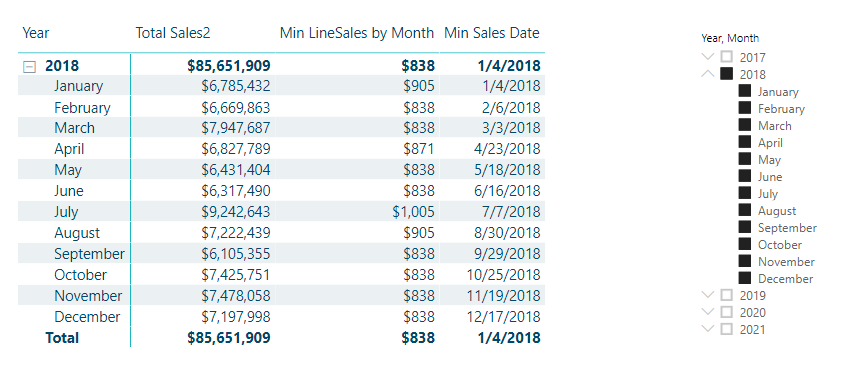
I hope this is helpful. Full solution file posted if you want to take a look at the Power Query steps in detail.
Thanks for the help and the insight into M. I am looking at it and looking to preserve the individual minimum sales on a daily basis. The group by overlays it. It is exactly what I was looking for. Now I want to try to adapt your suggestion.
Not sure what you mean by the “group by overlays it”. When you get to the Expand AllRows step, you can choose to retain any/all of your previous columns, so the group by step doesn’t result in overwriting/loss of any information (unless of course you want it to, by leaving any of the previous fields unselected).
Feel free to give a shout if you have any questions in implementing this approach in your model.
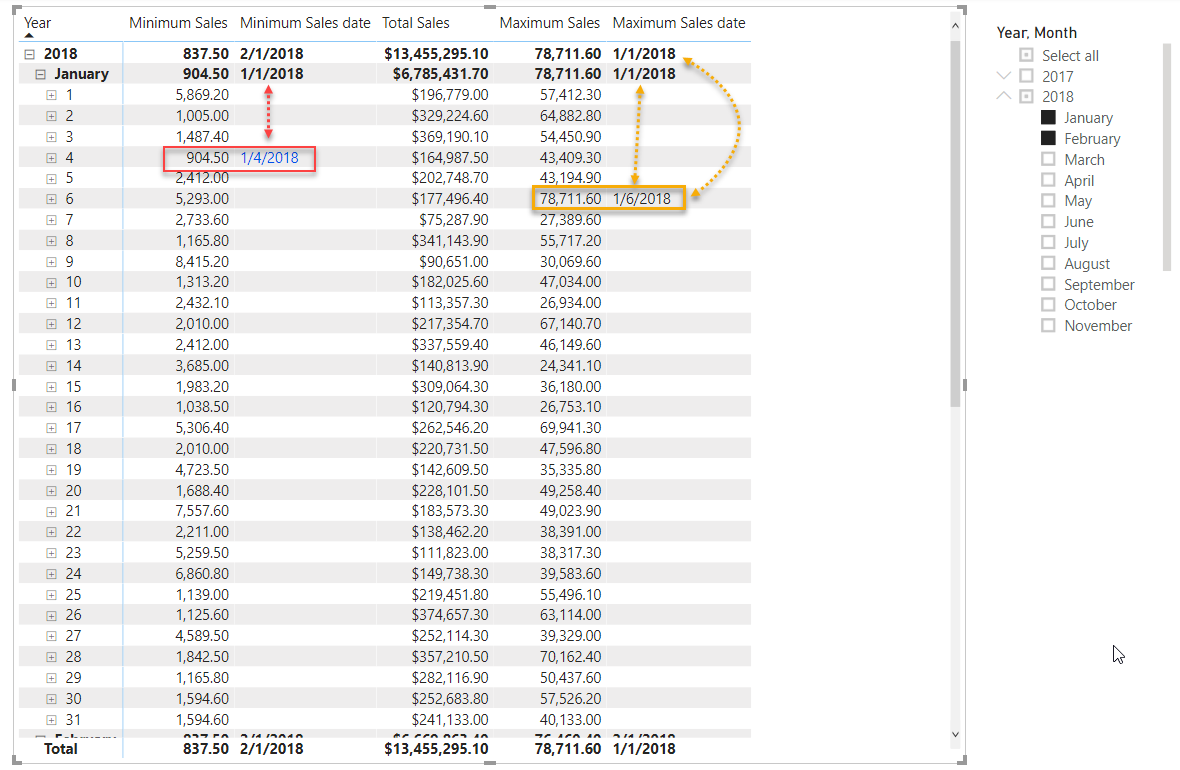
I retain the minimum daily sales but isolate the true minimum in the Minimum Sales Date where there is only one date that points to minimum amount for the month.
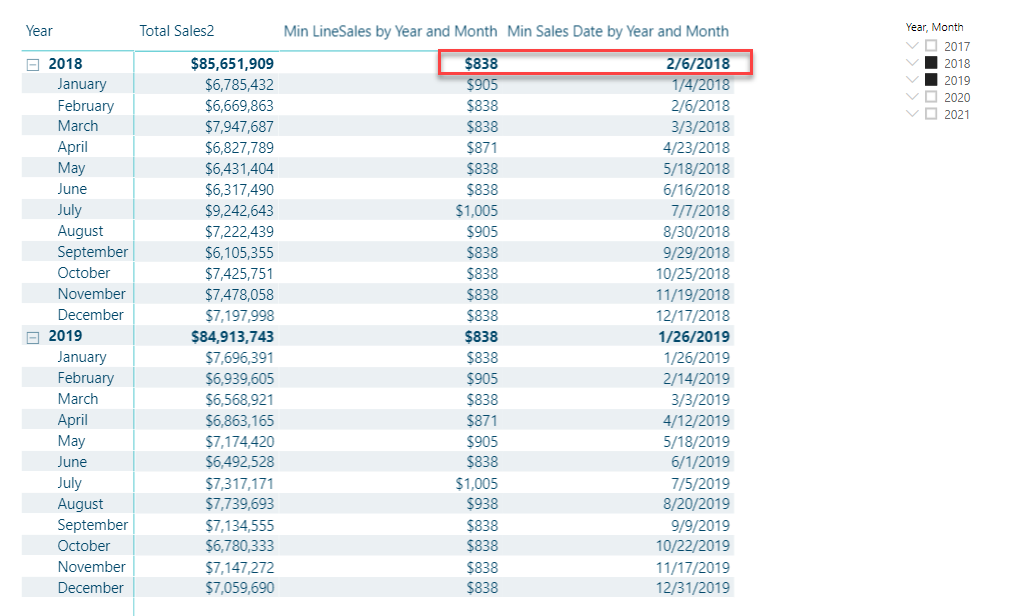
Then we use the DAX ISINSCOPE() function to determine what level of the hierarchy we are at in the matrix, and then SWITCH( TRUE() ) to choose the correct calculation, based on the ISINSCOPE determination:
Min Sales Date by Year and Month =

VAR MonthMin =
CALCULATE(
    MIN( Sales[OrderDate] ),
    FILTER(
        Sales,
        Sales[Line Total] = Sales[MinLineSales]
    )
)

VAR YearMin =
CALCULATE(
    MIN( Sales[OrderDate] ),
    FILTER(
        Sales,
        Sales[Line Total] = Sales[Min Line Sales Annual]
    )
)

RETURN
SWITCH( TRUE(),
    ISINSCOPE( Dates[MonthName] ), MonthMin,
    ISINSCOPE( Dates[Year] ), YearMin,
    BLANK()
)
One note – this is the case where the order of the items in the SWITCH statement makes a big difference. In a date hierarchy like this you need to work “inside out” from the most granular (in this example Month, in a full date hierarchy it would be Day) out to the least granular. Since Month is “in scope” of Year, if you put Year first, everything will get the annual minimum value.
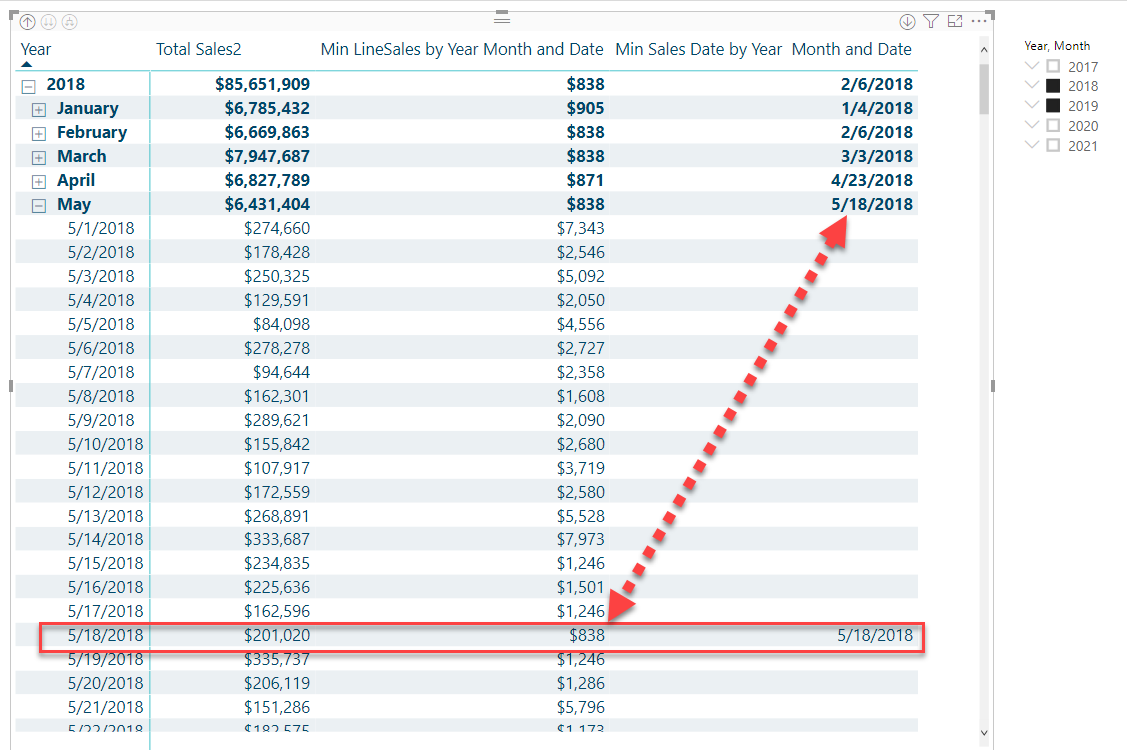
The changes was extending it for the Dates[Date]
[Min LineSales by Year Month and Date] =
SWITCH (
TRUE (),
ISINSCOPE ( Dates[Date] ), MIN ( Sales[Line Total] ),
ISINSCOPE ( Dates[MonthName] ), MIN ( Sales[MinLineSales] ),
ISINSCOPE ( Dates[Year] ), MIN ( Sales[Min Line Sales Annual] ),
BLANK ()
)
–
[Min LineSales Date by Year Month and Date] =
VAR DateMin =
CALCULATE (
MIN ( Sales[OrderDate] ),
FILTER ( Sales, Sales[Line Total] = Sales[MinLineSales] )
)
VAR MonthMin =
CALCULATE (
MIN ( Sales[OrderDate] ),
FILTER ( Sales, Sales[Line Total] = Sales[MinLineSales] )
)
VAR YearMin =
CALCULATE (
MIN ( Sales[OrderDate] ),
FILTER ( Sales, Sales[Line Total] = Sales[Min Line Sales Annual] )
)
RETURN
SWITCH (
TRUE (),
ISINSCOPE ( Dates[Date] ), DateMin,
ISINSCOPE ( Dates[MonthName] ), MonthMin,
ISINSCOPE ( Dates[Year] ), YearMin,
BLANK ()
)
This way I can look at the minimums at any level especially daily.