Awesome work
2 Likes
Wow, this is super cool!
I like everything in your entry!
Thank you for participation, have a great day!
2 Likes
Hello Friends!
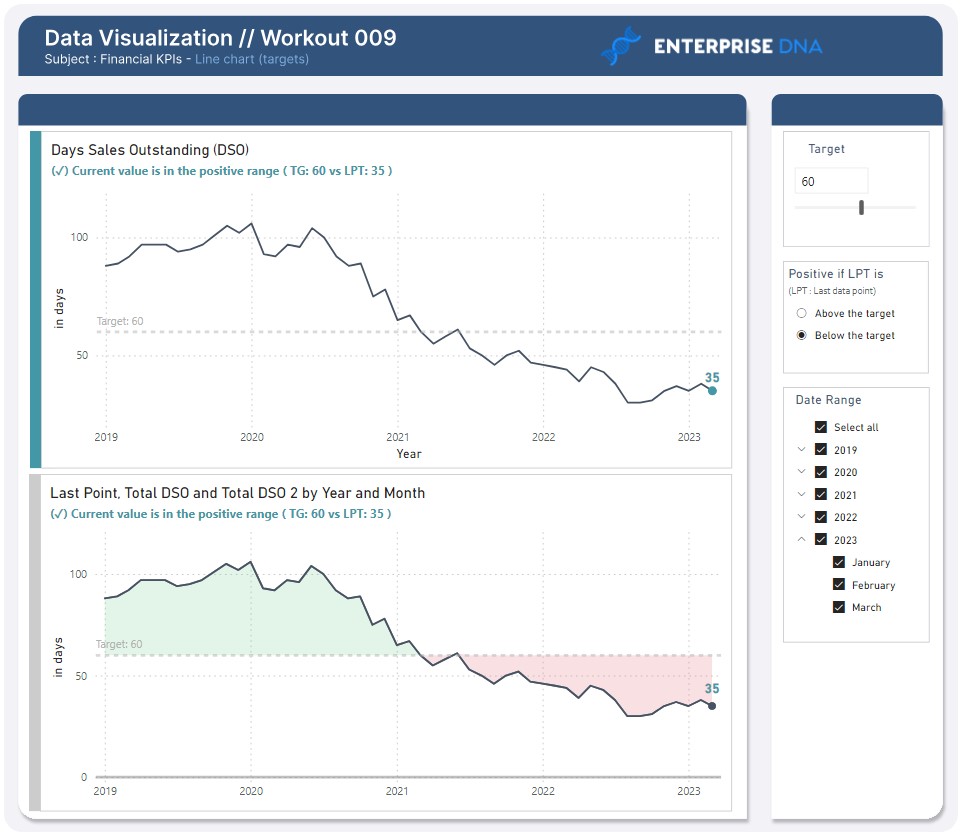
Find below my origin visualization set (PBI file may include some additional tables / measures that was not used to create this particular set of visualization).
Workout 009 - Gustaw Dudek.pbix (1.0 MB)
Have a great day!
4 Likes
Hi @Gustaw ,
Could you tell me how you formatted this point?
I have the impression that it is not a standard bullet point.
Thank
Remi
1 Like
Hi Remi.
In that particular case I did as follows:
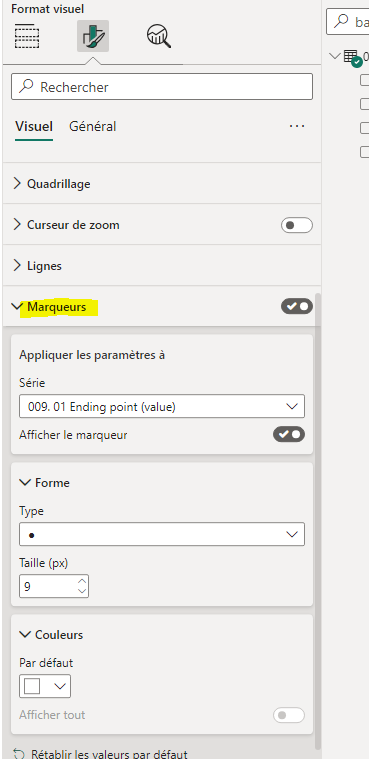
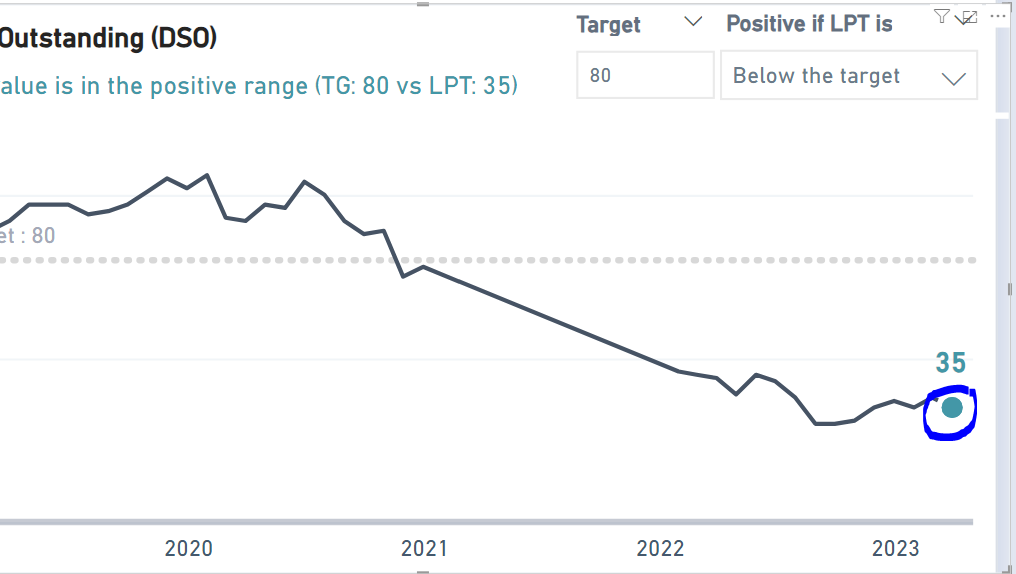
Created column chart and apply conditional formatting where all columns get transparent color (#ffffff00) except of the column with the last point (but… the last point additionally get the color depending on positive or negative relation to target). In other words - all points are transparent and the last point is either green or red.
Then I switched the visual to line chart (that way we create additional layer of markers: conditionally formatted columns becomes markers).
In that case, it allows for “saving” additional measures used in this visual.
1 Like
Thank you for your warm wishes.
2 Likes
Incredible, I could have searched for a few more days. ![]()
I will try to reproduce this chart.
Thank you for everything.
2 Likes
No problem Remi! : )
Looks awesome!
I really like how it looks like. It’s also great to see your personal touch in this workout in the form of additional smart narratives! Great entry!
Thank you for participation!
Gotta learn some cool tricks, thanks for the workout
2 Likes
workout 9 temp.pbix (178.6 KB)
@Gustaw @Roberto2 @Remi10 @renata_kulagowska
not returning a ending point value
the measures are current i don’t no what the problem
Hello all,
Here’s my submission for workout 9. Thank you Gustaw for this challenge.
EDNA Workout 9.pbix (135.3 KB)
1 Like