Hi use this:
Hi use this:
Hi
So you moved the name of the measure into the measure value…
And you did It in a cool way !
Bravo !
Yes and hide the measure name in the table.
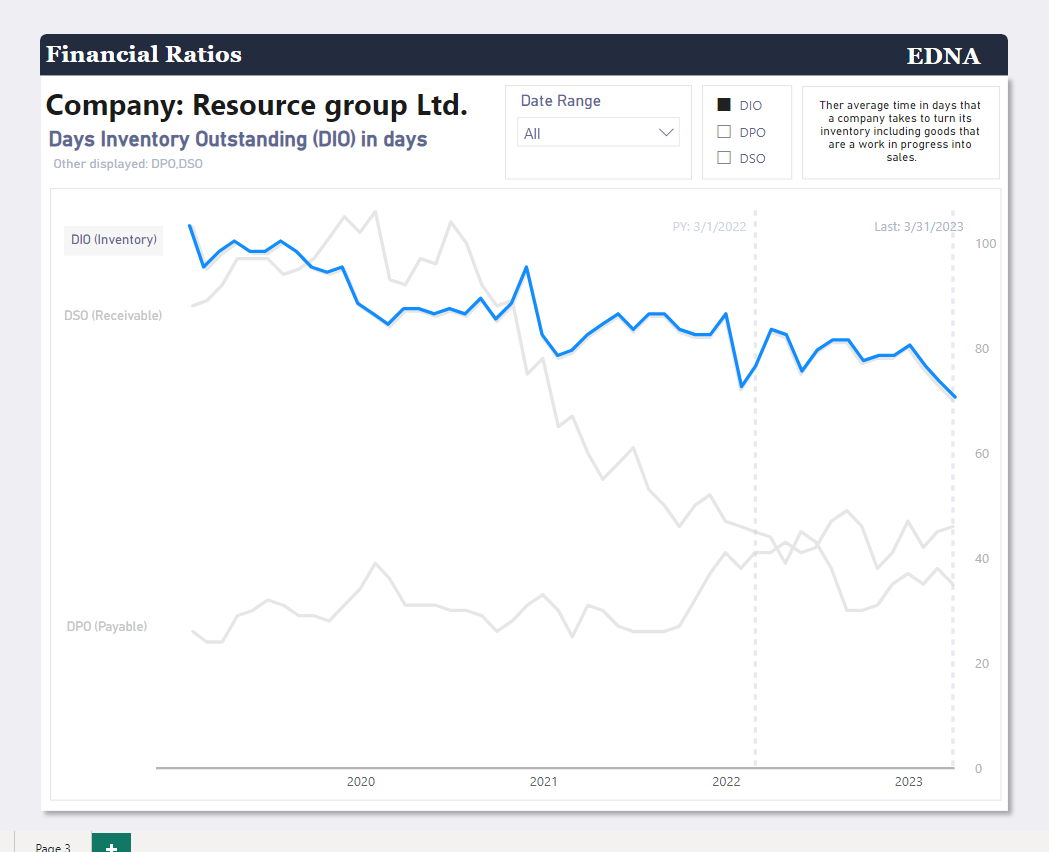
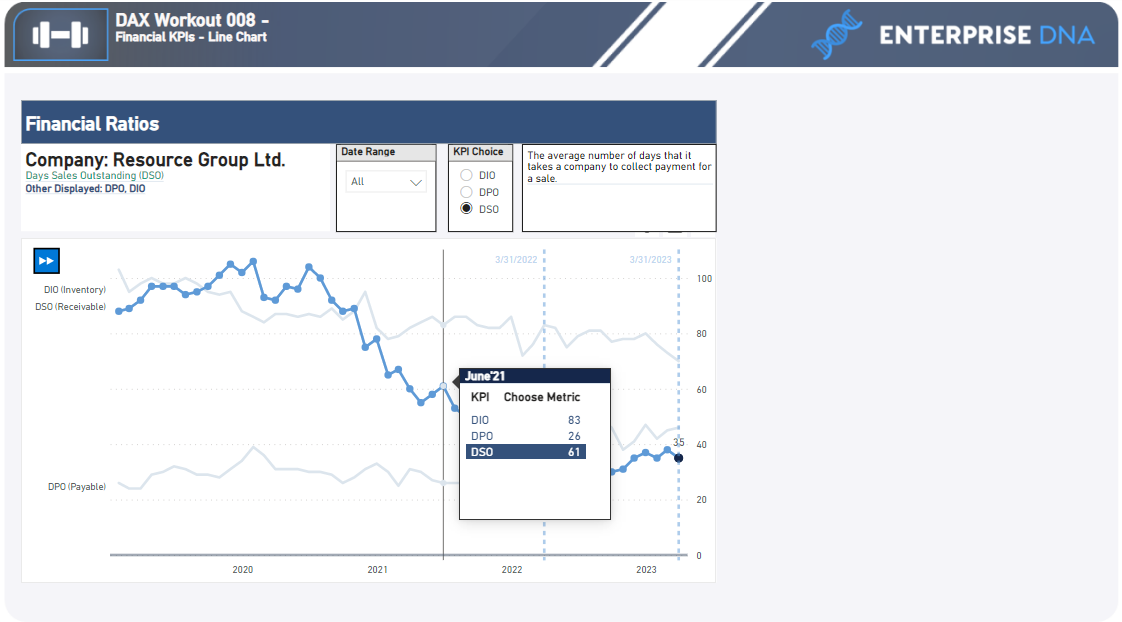
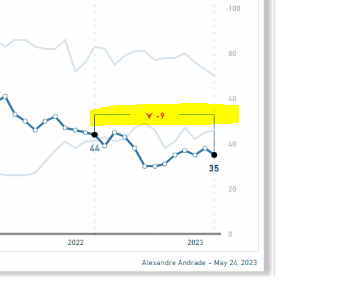
Do you have any clue how to hide the first value on the x-axis like in the example?
For example, the 2019 year don’t appear only 2020.
I have tried some ways but at the moment any one solve the problem.
@AlexandreAndrade
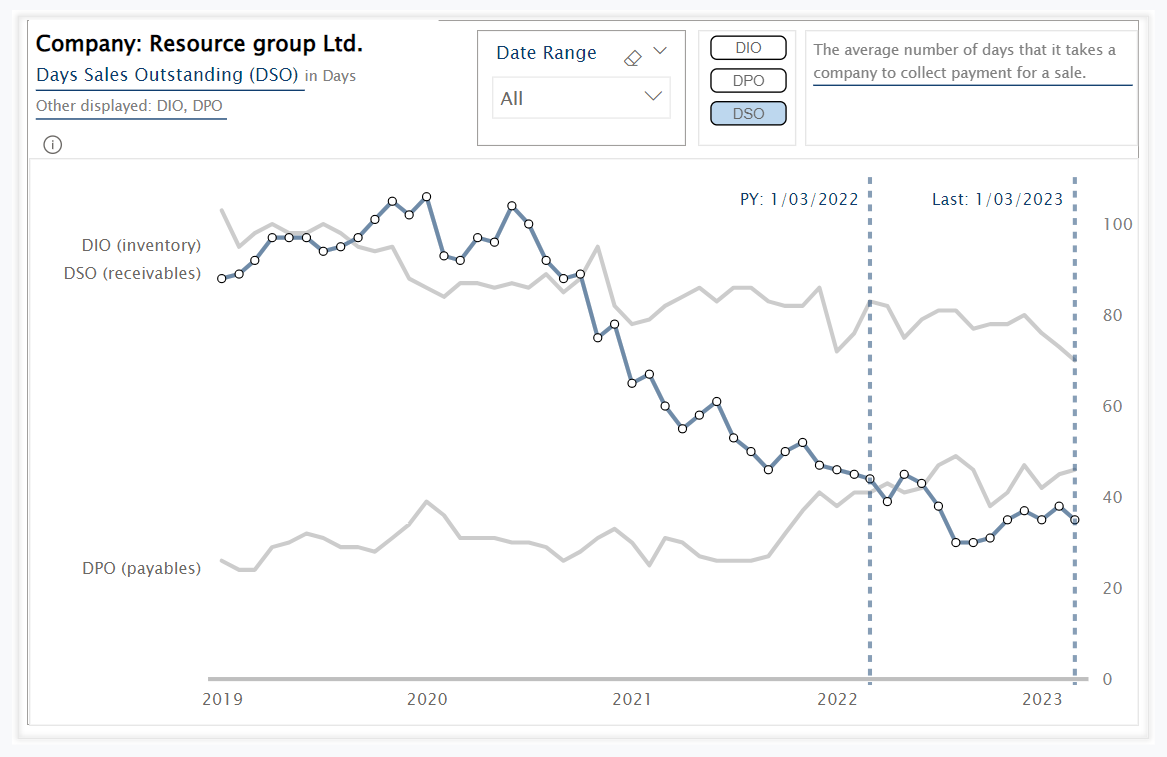
Visibility of 2019 might relate with the date used (start of month or end of month). Need a double-check.
For clarification, “hidden” 2019 in my screen shoot example is not included as the “subject” of this particular workout (in case you would like to make a 1v1 replica of my version).
Nevertheless, awesome to see that you solve all the “obstacles”!
Great work everyone!
Thank you. I’m curious to see your solution to this workout.
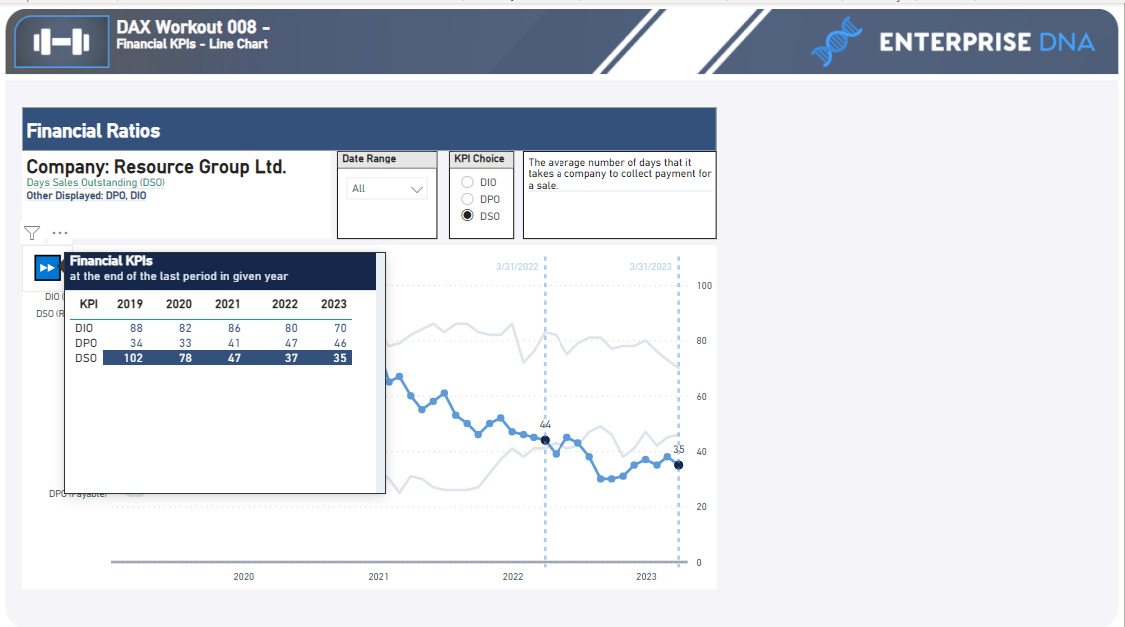
I still have a bit more to do on this challenge. I must say, I don’t know how the heck you’re dynamically highlighting your line chart with only one graph ![]() . I can’t wait to see your solution.
. I can’t wait to see your solution.
Hi,
As I said before this workout was harder than I expected, but I’m really glad I managed to finish it.
Here my solution:
Workout 008_AA_Final.pbix (551.6 KB)
Hello Friends!
Find below my origin visualization set (PBI file may include some additional tables / measures that was not used to create this particular set of visualization).
Workout 008 - Gustaw Dudek.pbix (1017.9 KB)
Have a great day!
Awesome KimC
Took me a little while - and I am still tweaking this.
@Gustaw Thanks for challenging me on these visualizations!
A quick update to my submission:
fantastic !
Hi,
If you can let me know how you build the in btw line in the visual.
It will be very helpful.
Thanks
Sorry, I don’t understand what line you want me to explain. Please, mark the line and I’ll explain you.
Hi,
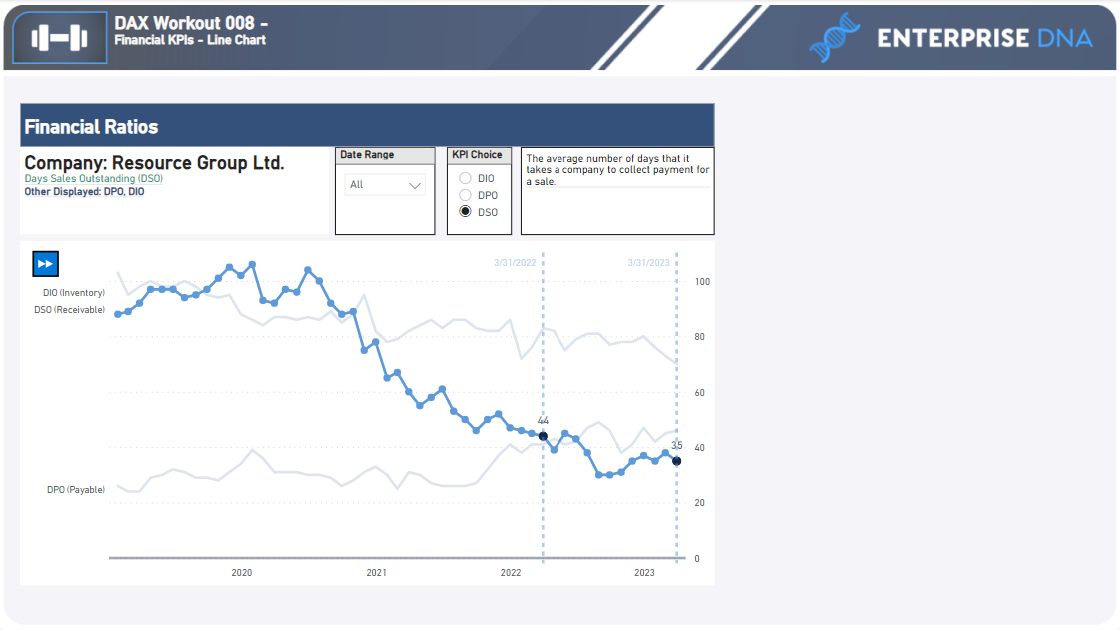
Just wanted to know how the highlighted line has been built with the number in btw.
Thanks
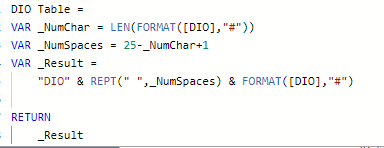
Ok, I will try to explain:
There are two measures:
Do you understand?