Data setup for comparing summary financials from multiple companies

I’m a PBI beginner and am working through multiple Enterprise courses but I’m having trouble applying what I’ve learned from the financial statements course to a “Quick and Dirty” report I’m trying to build as a “proof of concept”. I plan on redoing this report the correct way once I have worked my way through more Enterprise Courses but for now I just need something simple.

Basically what I am trying to do is create a report that utilizes up to 5 years of summary financials and operational data from multiple companies. For the sake of this example, I’m going to use just revenue data and I’m going to reduce the table size. The table format is still the same.

Within an excel book there is a revenue data table for inputting revenues by category for a given store. Here is an example data table for Store 1.

Once the table is filled out I have a macro that copies and pastes the data into a database table on a separate sheet and then erases the inputs so that the next company’s info can be added. With the way the macro is set up right now it simply copies and pastes each new data table below the last submitted table.

the database table where these entries are being pasted is the table that I will connect to PBI. This is done with 5 other data entry and database tables that will also connect to PBI.

The problem I’m having is that I’m not sure how to transform these 5 data tables in PQ so that I can connect the database tables by store for easy comparison.

If I have 5 years of data for each store does that mean I need to have a row for each year of data for each store with the column headers now being revenue category like I’ve done below?

My excel background is pretty strong but my database experience and knowledge are very weak. I need to improve these skills tremendously which is why I enrolled in these courses but for right now I just need to get this simple prototype report built. This will just be used for show in a demo and while it does need to have some functionality it doesn’t need to be done “the right way”.

Hi @Sdowney,

Welcome to the forum!

@Greg recently did a great series on Best Practices, the first two in that series can be found here.

and

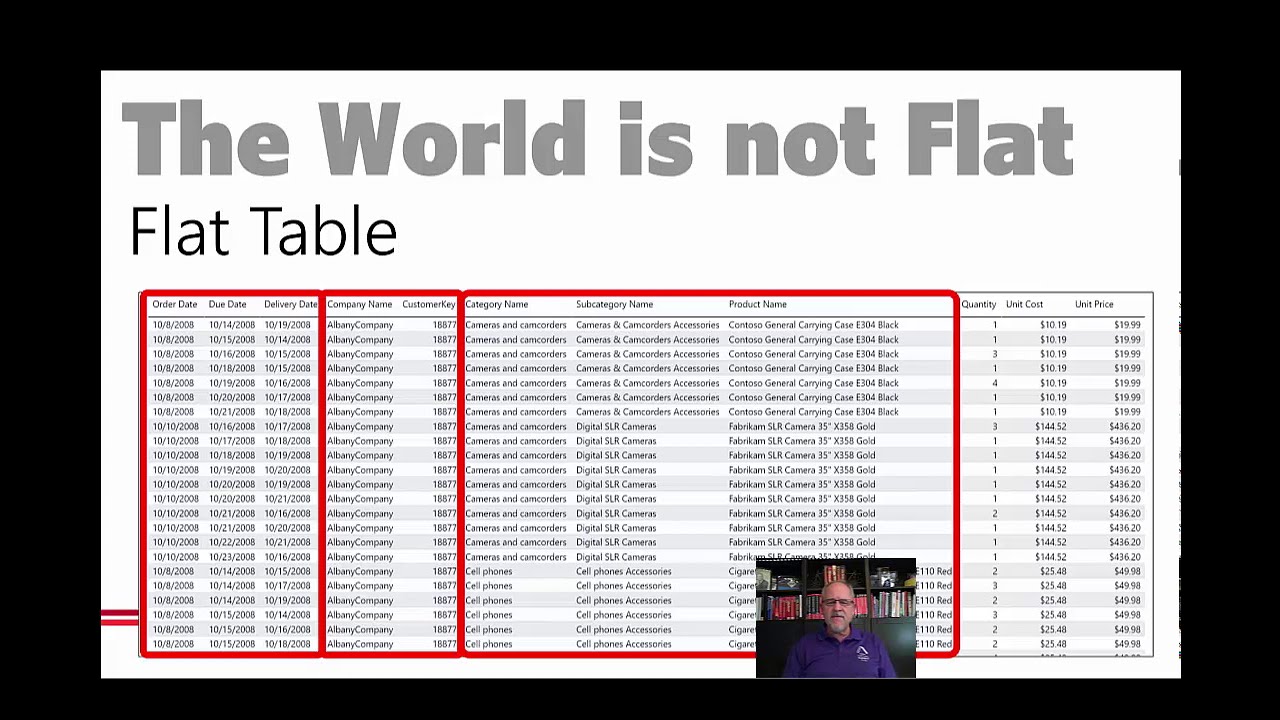
You could say each model consists of 2 types of tables; dimension- and fact tables.
Dimensions are attributes that you can slice and dice the data by and facts are “what happend”
The first is typically short and wide(r) and the latter typically long and small.

In Excel it doesn’t really matter if you aggregate over columns, rows or a combination but in Power BI, you aggregate over columns (modified by filters). That’s why the table shapes are different so your fact table could look something like this.

image

And your dimension tables could look like this.

image

and

Always think about granularity, everything is now aggregated on an anual level. This generally means you can’t report on a lower level like: Quarter, Month, Week or Day.

Dispite that, this doesn’t mean your Date table is as well… There are a set of requirements for a proper Date dimension table which is a requirement for all time intelligence DAX functions.
Rule of thumb. If you have a date field anywhere in the model, always include a Date dimension table.
.
Next up modelling.
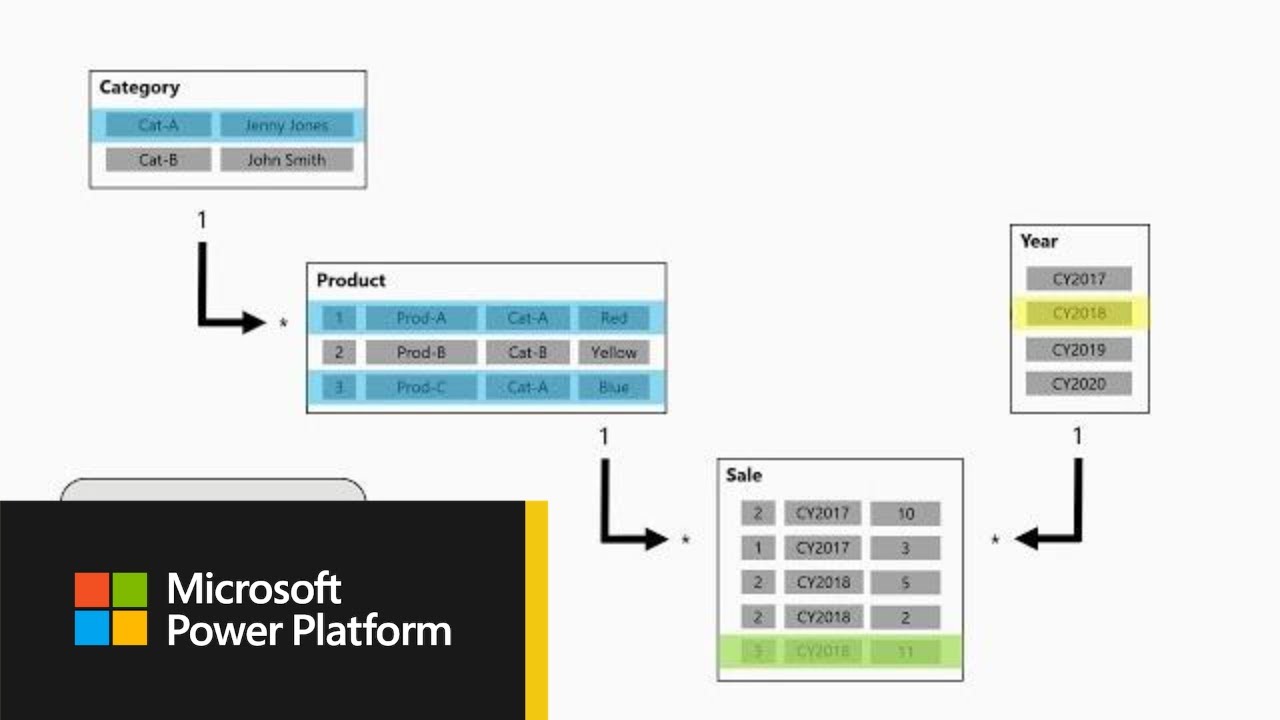
You could say there are two main model types: star- and snowflake schemas.
Power BI is optimized for the first. So try to design your tables with that in mind. Denormalize dimensions if necessary (below a Star schema). Do a websearch to learn more about these models.

Never trust Power BI automatically guessed the relationship cardinality and/or cross filter direction correctly. Make a habbit of hiding key fields in your fact table(s), so you can’t select them by mistake.

image
.
Here’s an example based on what you’ve shared.
Sample model.pbix (60.2 KB)

I hope this is helpful.

4 Likes

Hi Melissa,

Sorry for the delay in getting back to you and thank you for this detailed response. This answer definitely helped and set me down the right path for what I need to be thinking about.

I’m going to start with those two videos you linked to but beyond those are there any other DNA courses or non-DNA courses/books/resources/etc that you would recommend for getting a better understanding of not only Power Query but data modeling and database structure in general?

Thanks again for the response!

Hi @Sdowney,

Glad to read that was helpful for you. :+1:

A good startingpoint are the Ultimate Beginners Guides and Data Transformations & Modelling you can access through the portal. Also check out the other videos in the series Greg did on YouTube.

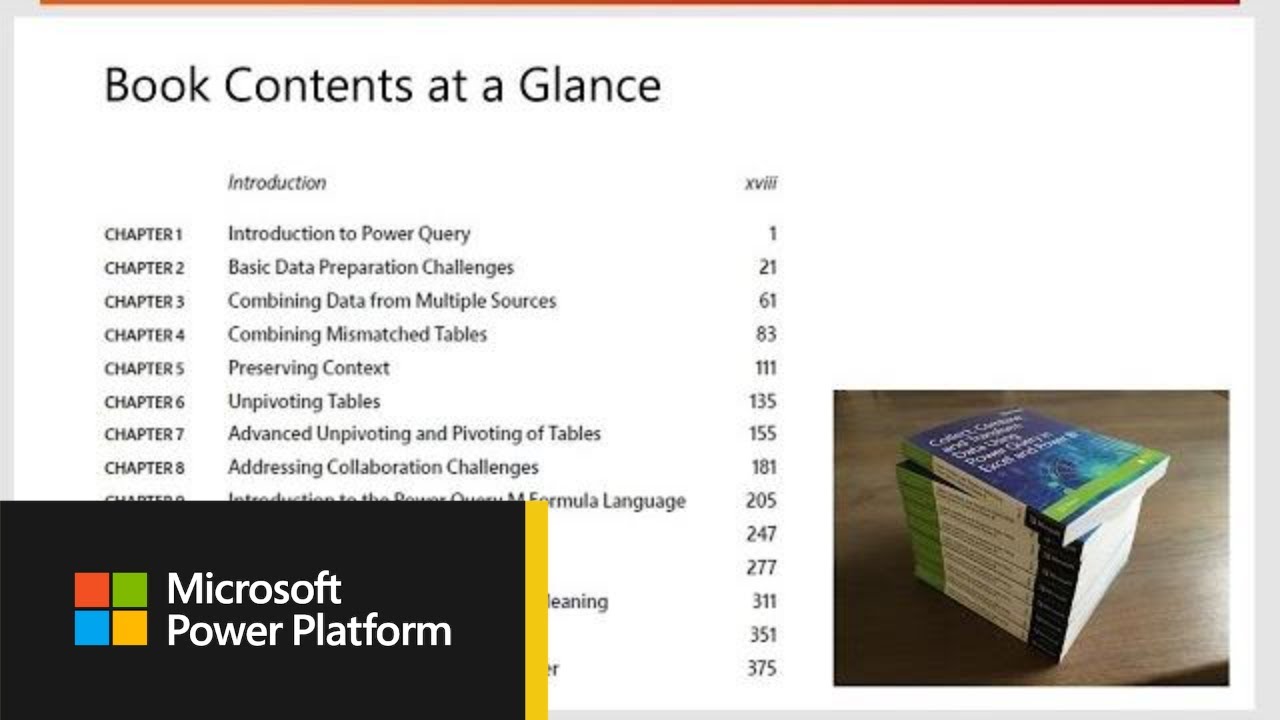
A very practical book by Gil Raviv: Collect , Combine , and Transform Data Using Power Query in Excel and Power BI.

.
More geared towards Data Modelling and Relationships.

and book recommmendations, check out this list by Nick

I hope this is helpful.