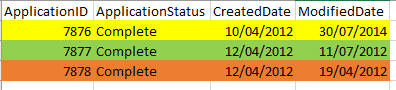
In my application table the program holds all applications including the status of the application. I have limited this to 3 different applications. In this table it holds the status of the application, which is the last known status.
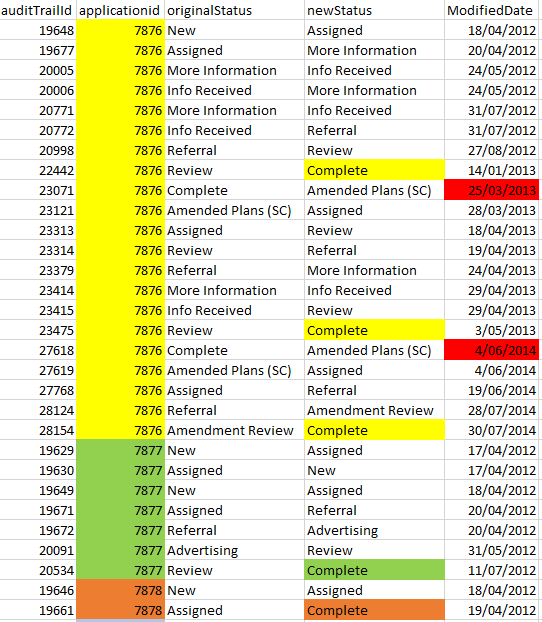
In the AuditTrail table it holds all of the status changes for each application. e.g. Application ID 7876 has 21 different status changes over the life of the application. However we need to make a calculation based on the completed date.
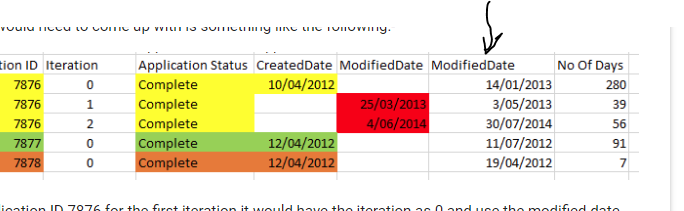
On Application ID 7876 for the first iteration it would have the iteration as 0 and use the modified date from the Audit Table when the application moves to Complete.
For the second iteration it would then use the modified date from the Audit Table when the application moved from Complete to Amended Plans (SC) - 25/03/2013 and the modified date when the iteration was set to complete again 3/05/2013.
The same for the 3rd iteration use the modified date from the Audit Table when the application moved from Complete to Amended Plans (SC) - 04/06/2014 and the modified date when the iteration was set to complete again 30/07/2014.
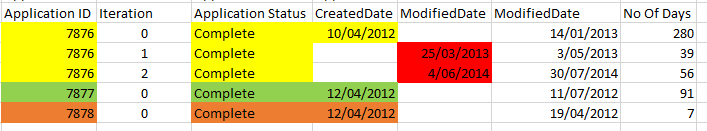
You could then use these dates to calculate the number of days between the two dates.
Do I bring both tables into Power BI and then create the logic in there or do I do this in SQL and create a new table with the required fields?
Quite difficult this one, I’m not understanding it 100%.
Are you trying to rearrange the table so that you have every before created, and modified date all in a number of rows instead of in a long and thin table like your first image?
You would likely need to iterate through the table and be able to find date.
I would probably find these dates first.
You could work your way through the table and find the completes and associate them to the whichever complete they are.
Then work out the new modified dates by finding the next date after the complete dates you just found.
That’s how I would do this I feel if this is actually what you need. I would likely complete these as calculated columns.
Can you add in some sample data? To me, I’d much rather have power query do this vs. DAX (but maybe that’s just me). But either way, I dont really want to type all of that data
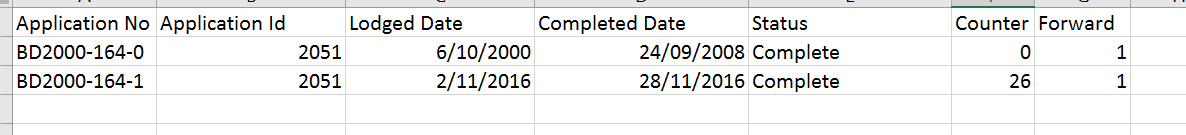
You can see from the screenshot that for this application BD2000-164 it has 7 changes on it. Basically we only care about when the application was lodged and when it was completed. Then if it moves off completed again and starts the process again it should add the next number after the hyphen (in this case a 1). It should then look to see when the next Complete status occurs and then use the change date as the Completed Date.
@Yted,
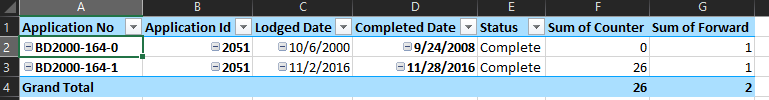
Take a look at the attached excel file and see if it is what you had in mind. There’s a few steps in there, but you can step through them. It could probably be cleaned up a bit, but I believe it is what you had in mind, but you know your data a lot better than I do.
Looking at your example for BD2000-164 I get the following output: