Data Modelling Workout 06 - Many-to-Many Part II

Estimated difficulty level:

INTRO

In this workout, the second in our series of dealing with many-to-many relationships, we are going to focus on a technique that has been an absolute game-changer for me in elevating my data modeling skills - adjusting mismatched granularities.

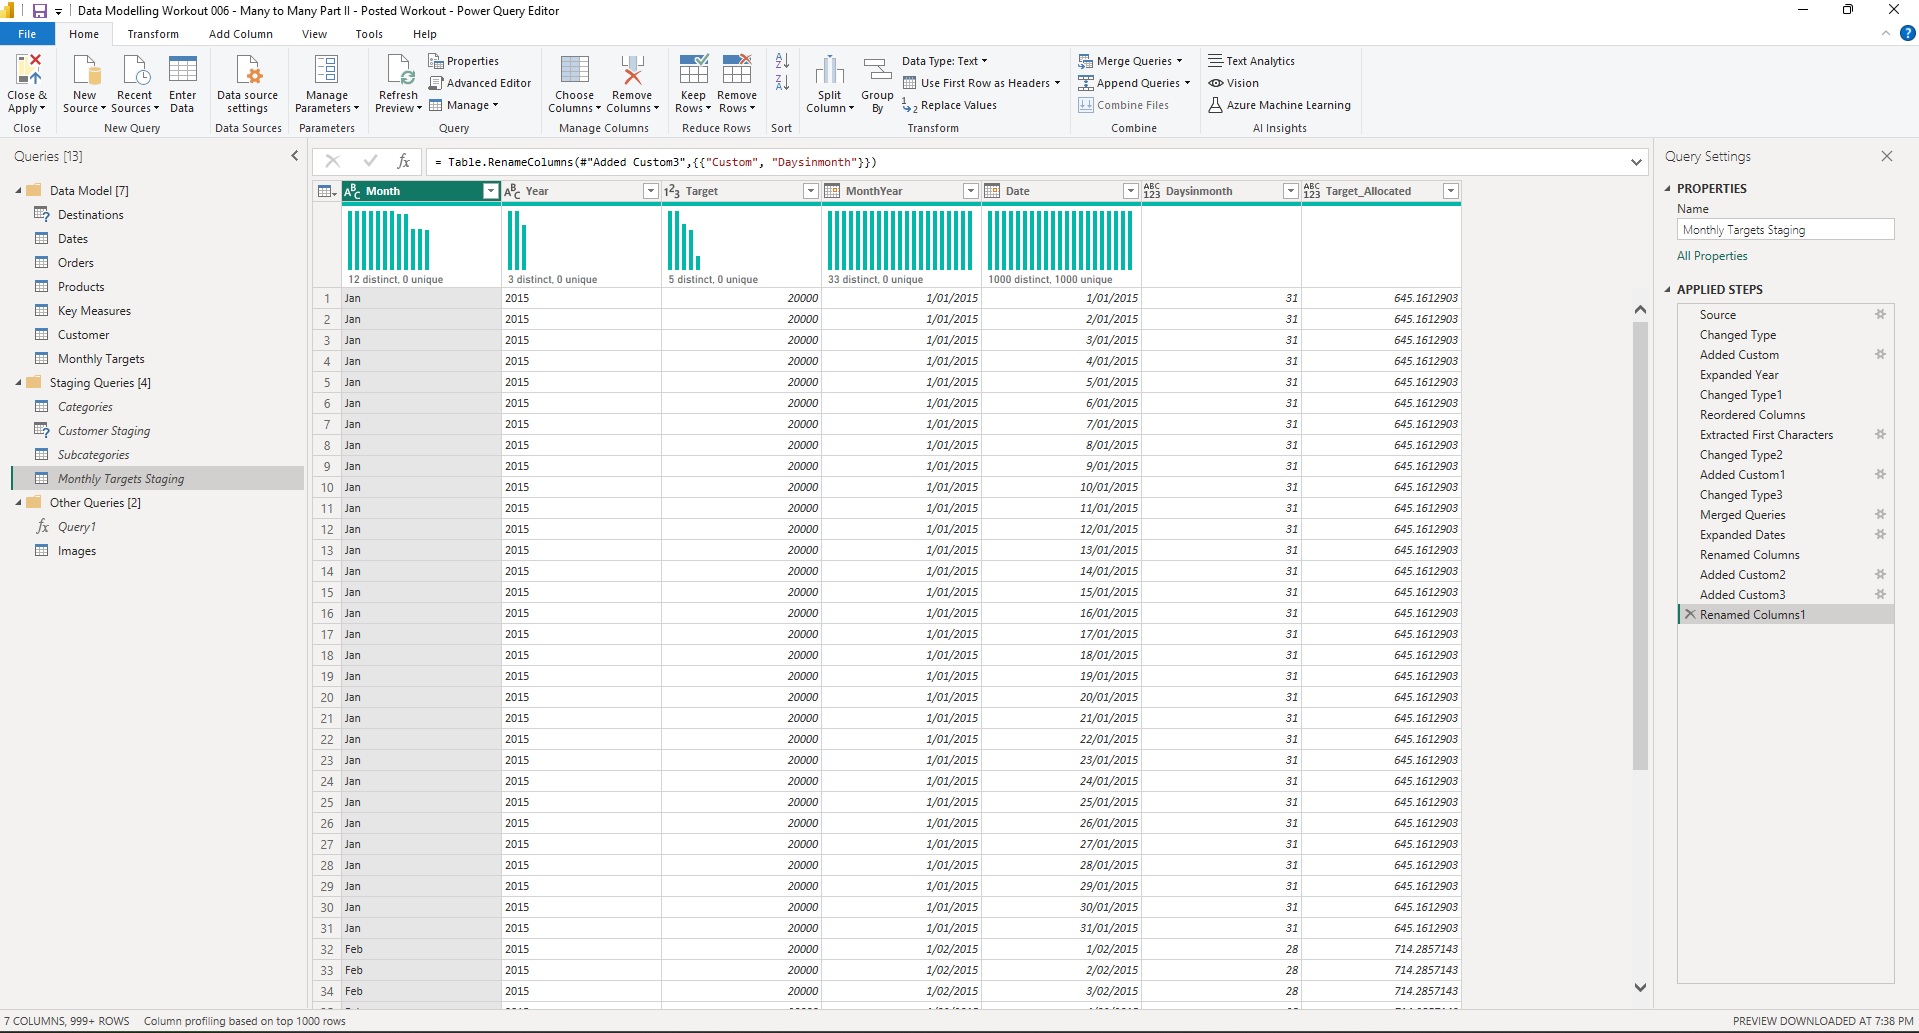
In this week’s workout, our many-to-many dilemma results from a mismatched granularity between our Dates table (daily granularity) and our Monthly Sales Targets (obviously, monthly granularity).

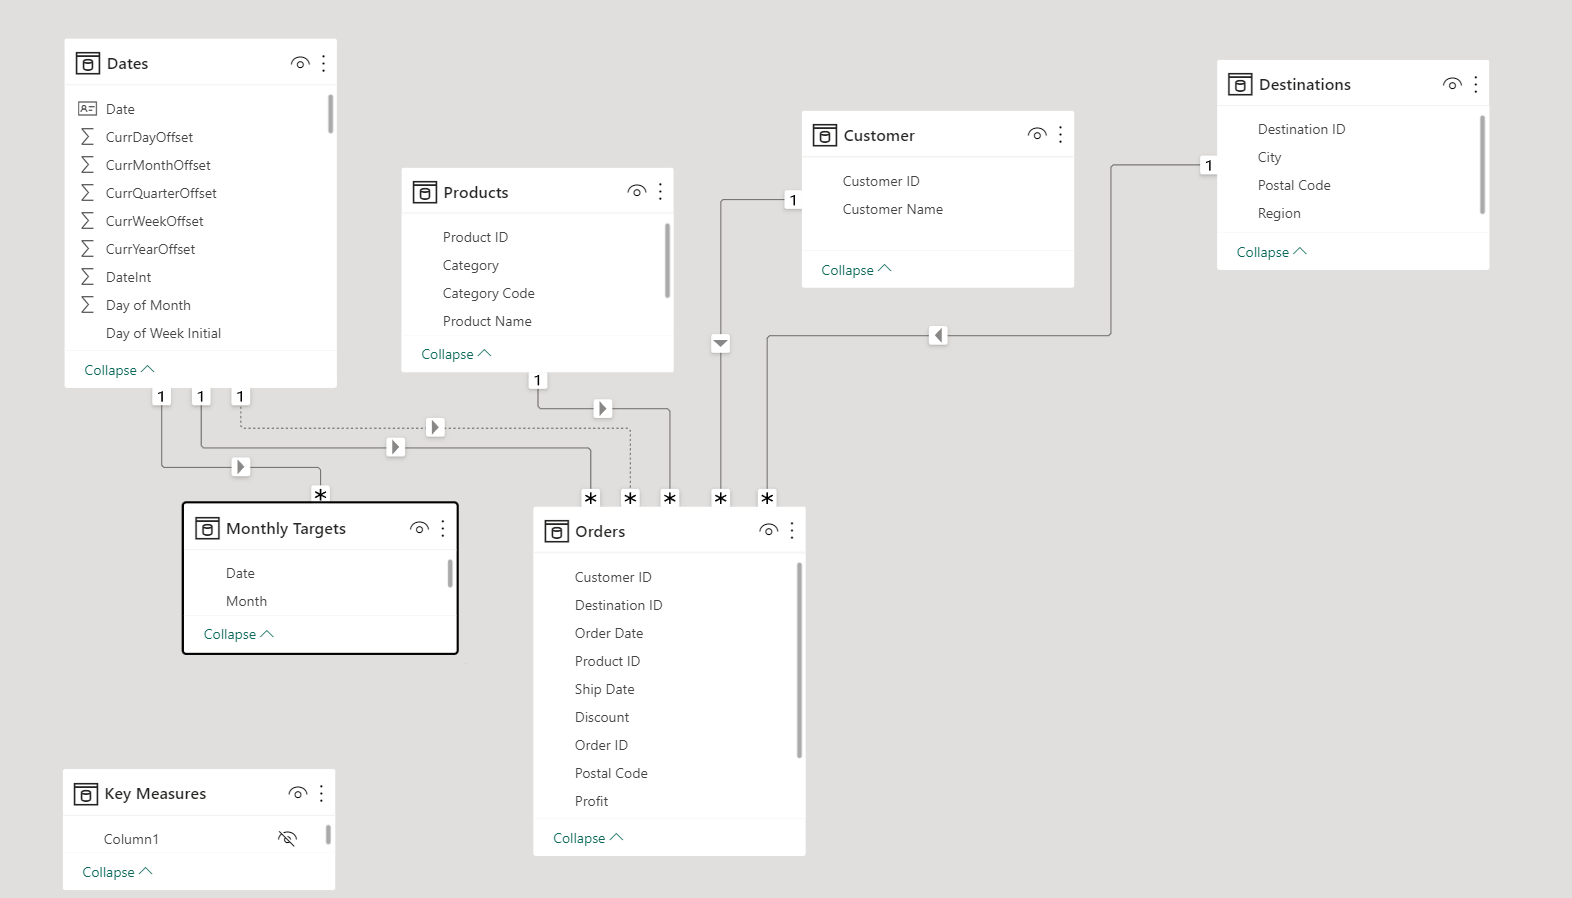
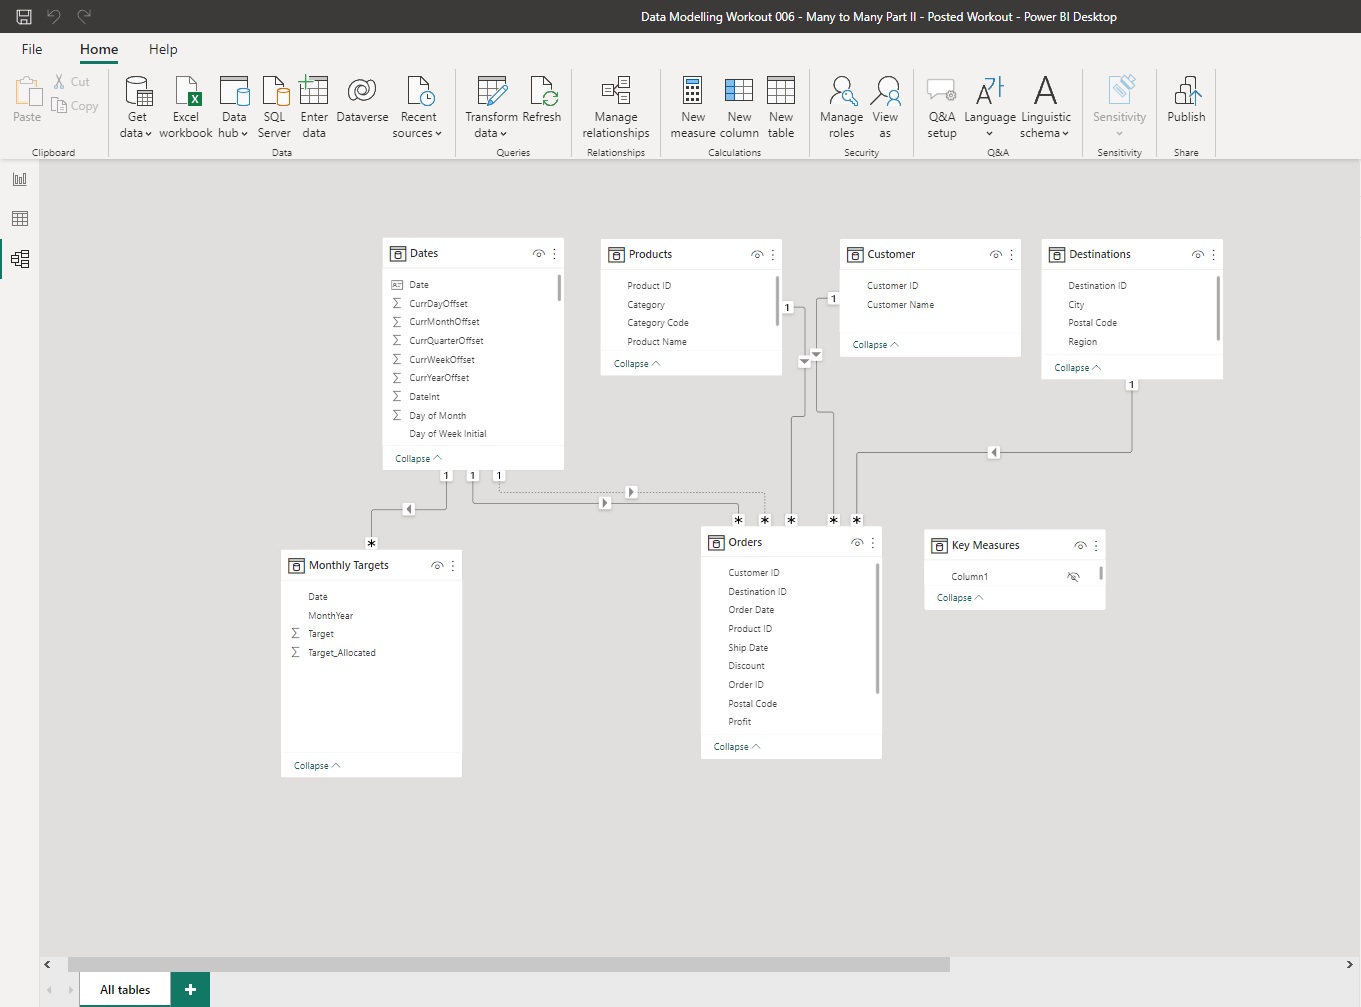
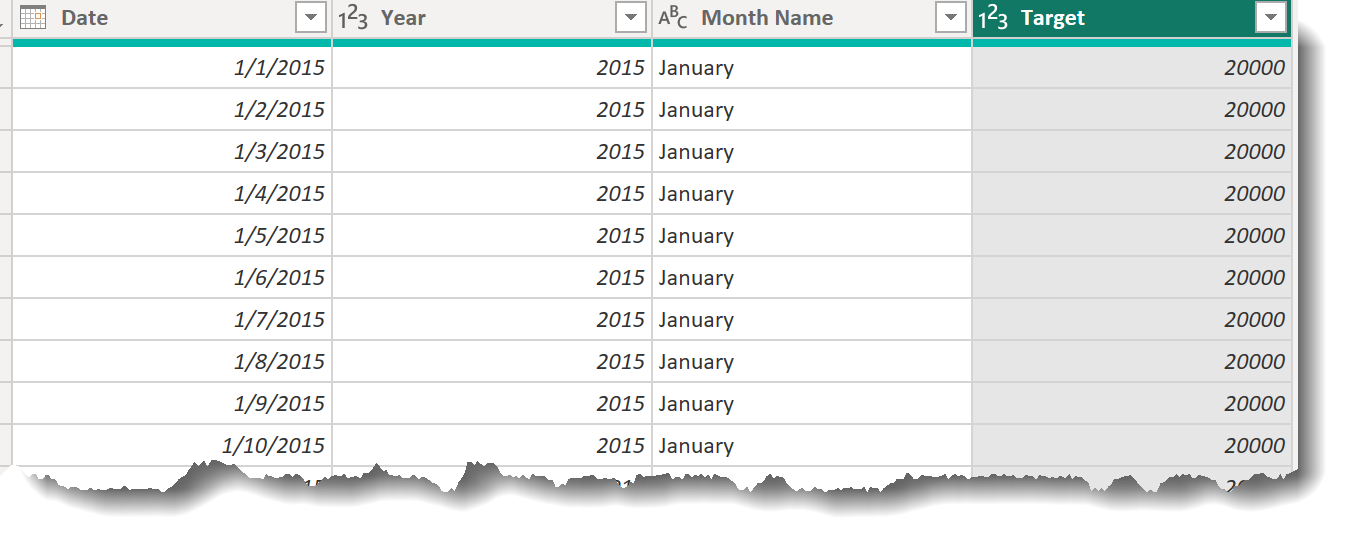
However, by allocating the monthly targets to daily granularity, the many-to-many problem disappears, and we can simply connect the Dates table to the Sales Targets table in a 1:M relationship, maintaining our nice star schema model.

This scenario comes up quite frequently, and mastering the technique here will give you a flexible and powerful weapon in your data modeling arsenal.

So, let’s get to it!..

OBJECTIVES:

For this Workout, we return to the office supply store we addressed in Workout 003.

In that Workout, we denormalized a snowflake schema into the standard star schema we now have here.

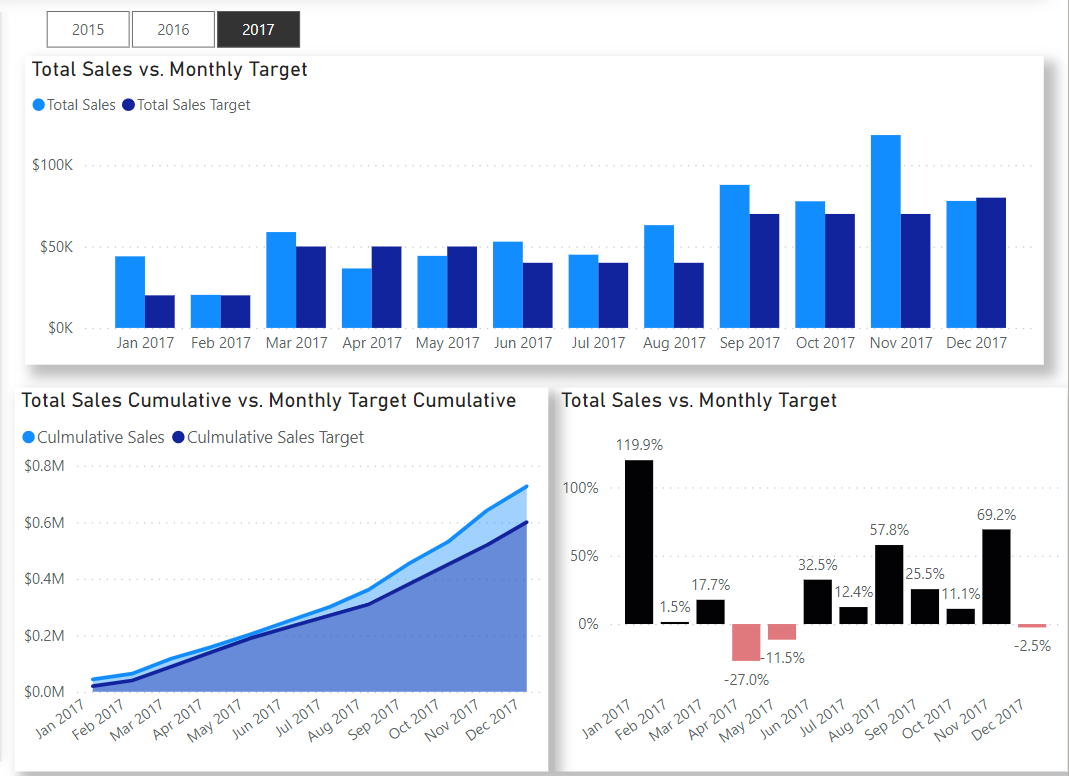
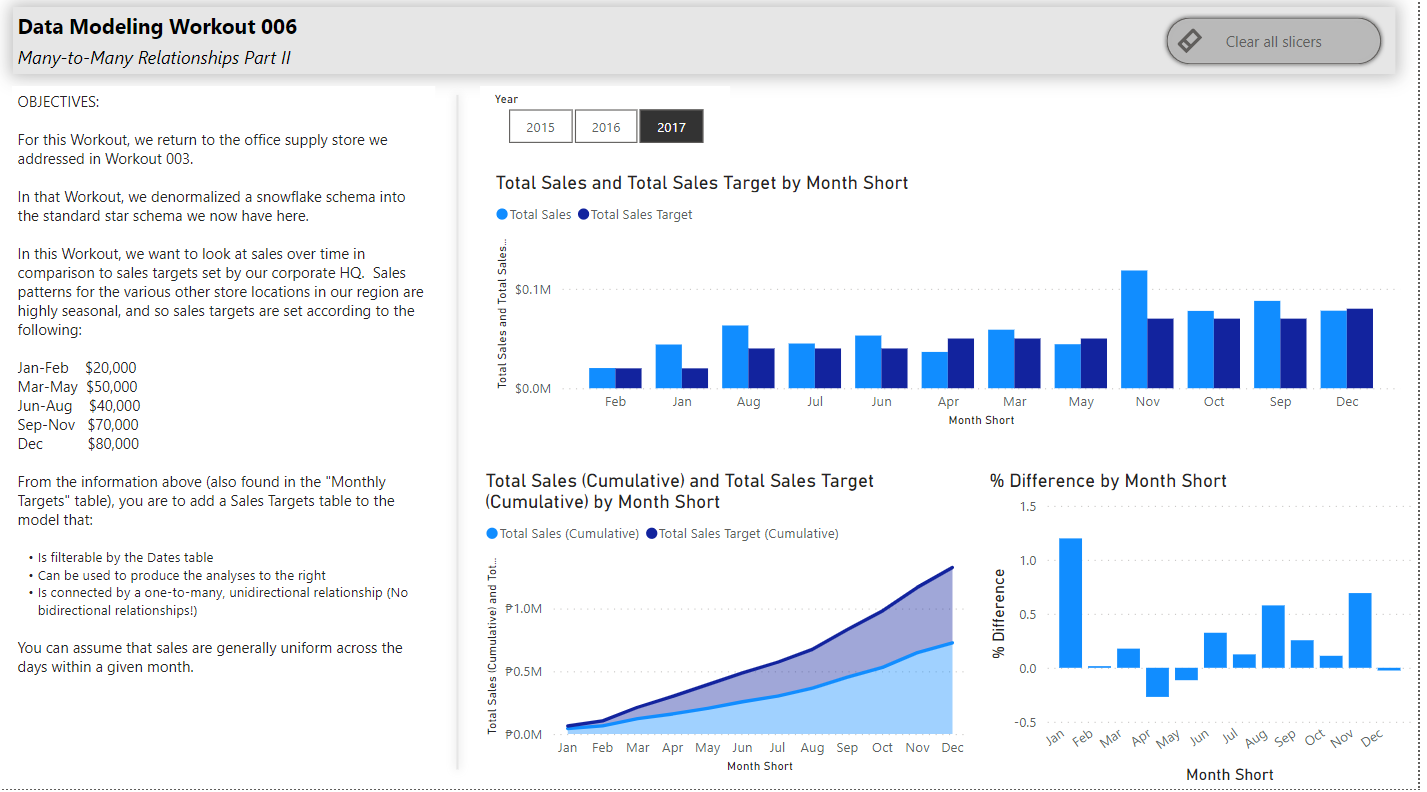
In this Workout, we want to look at sales over time in comparison to sales targets set by our corporate HQ. Sales patterns for the various other store locations in our region are highly seasonal, and so sales targets are set according to the following:

Jan-Feb $20,000
Mar-May $50,000
Jun-Aug $40,000
Sep-Nov $70,000
Dec $80,000

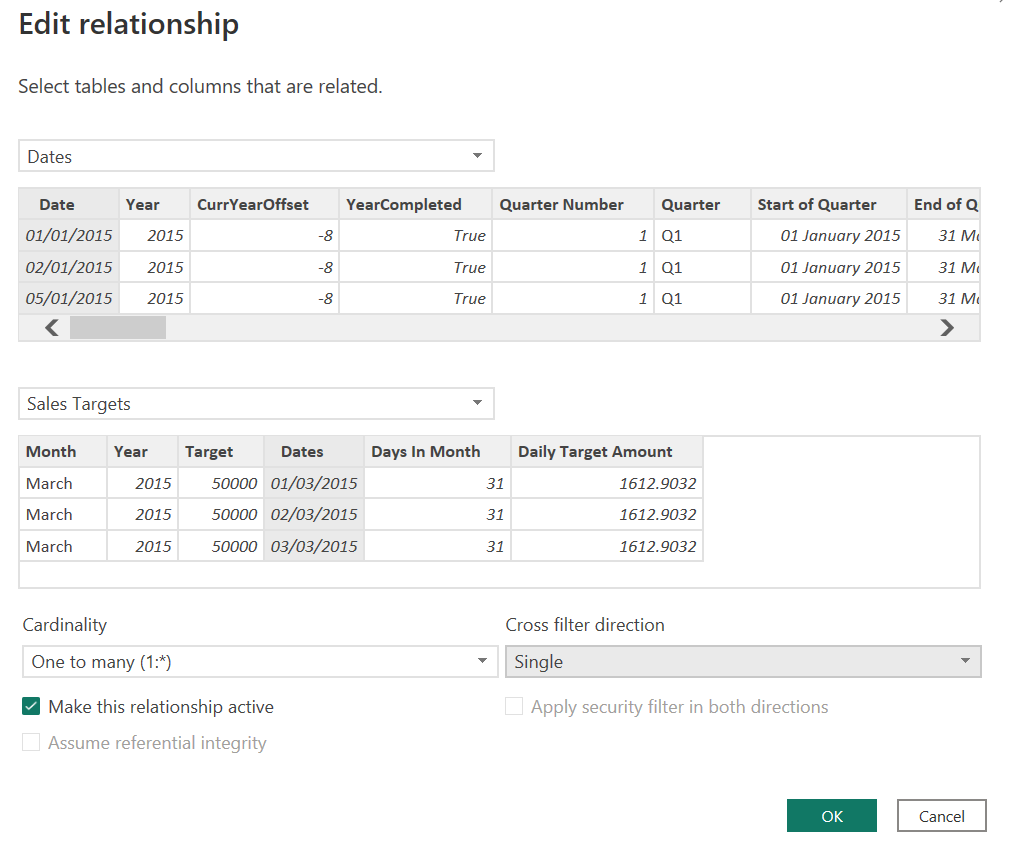
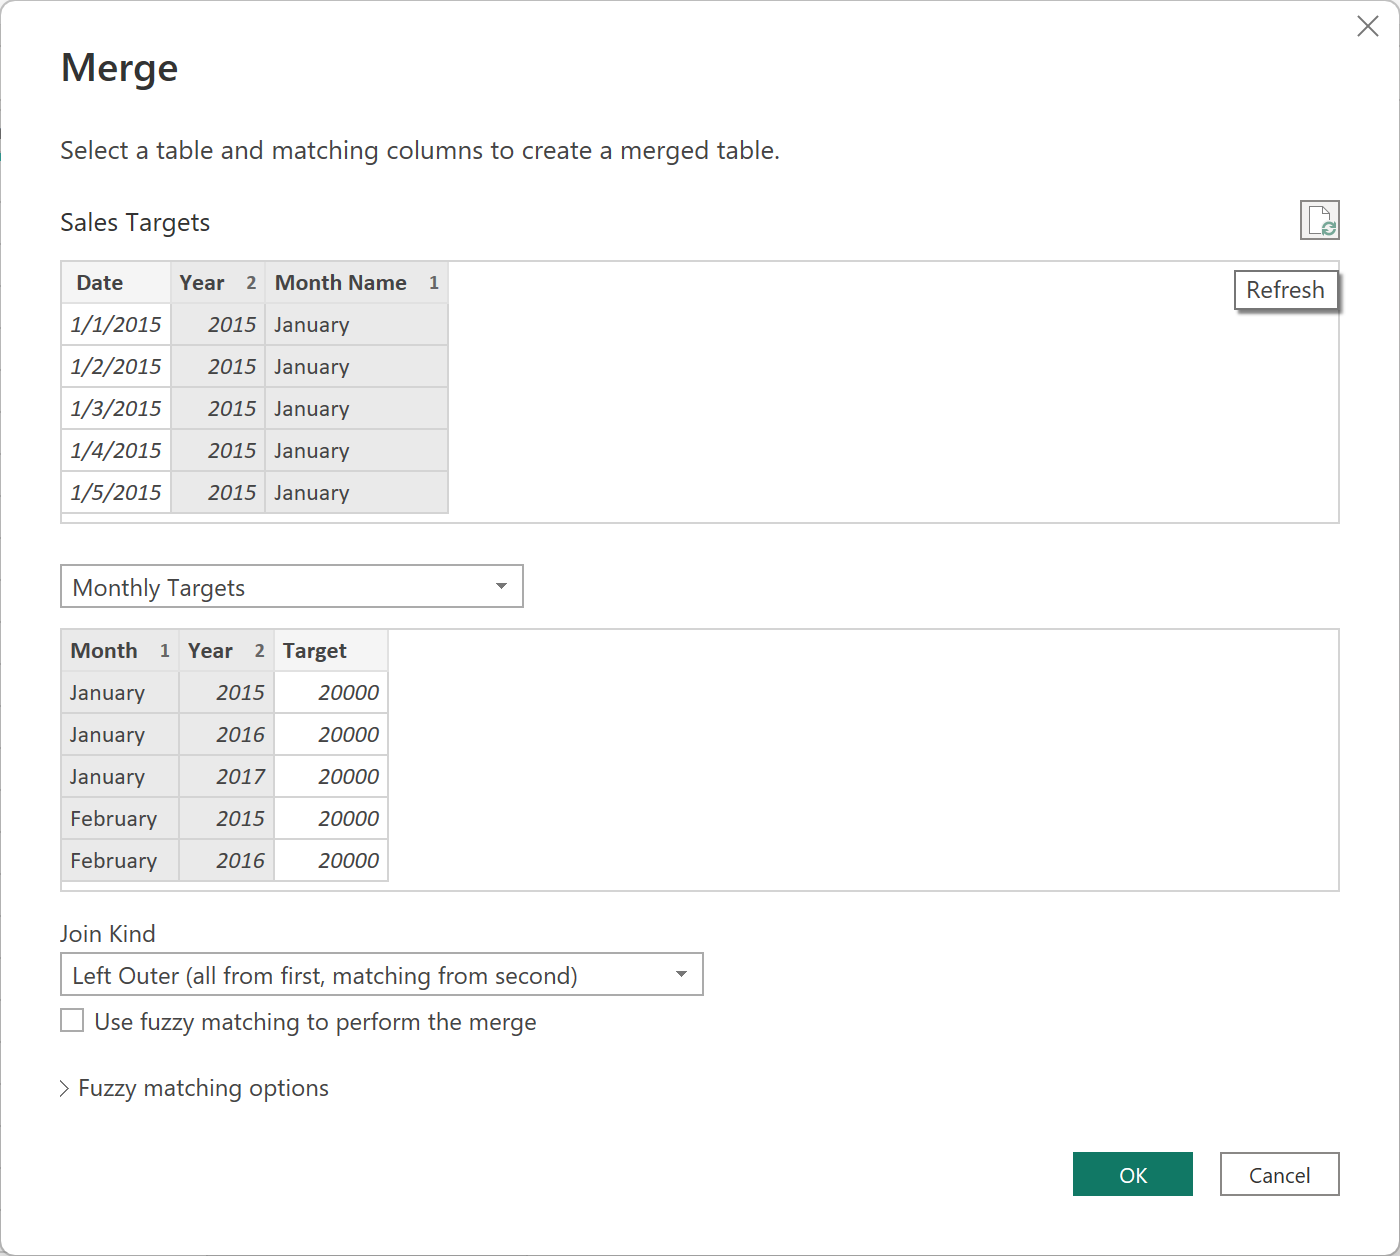
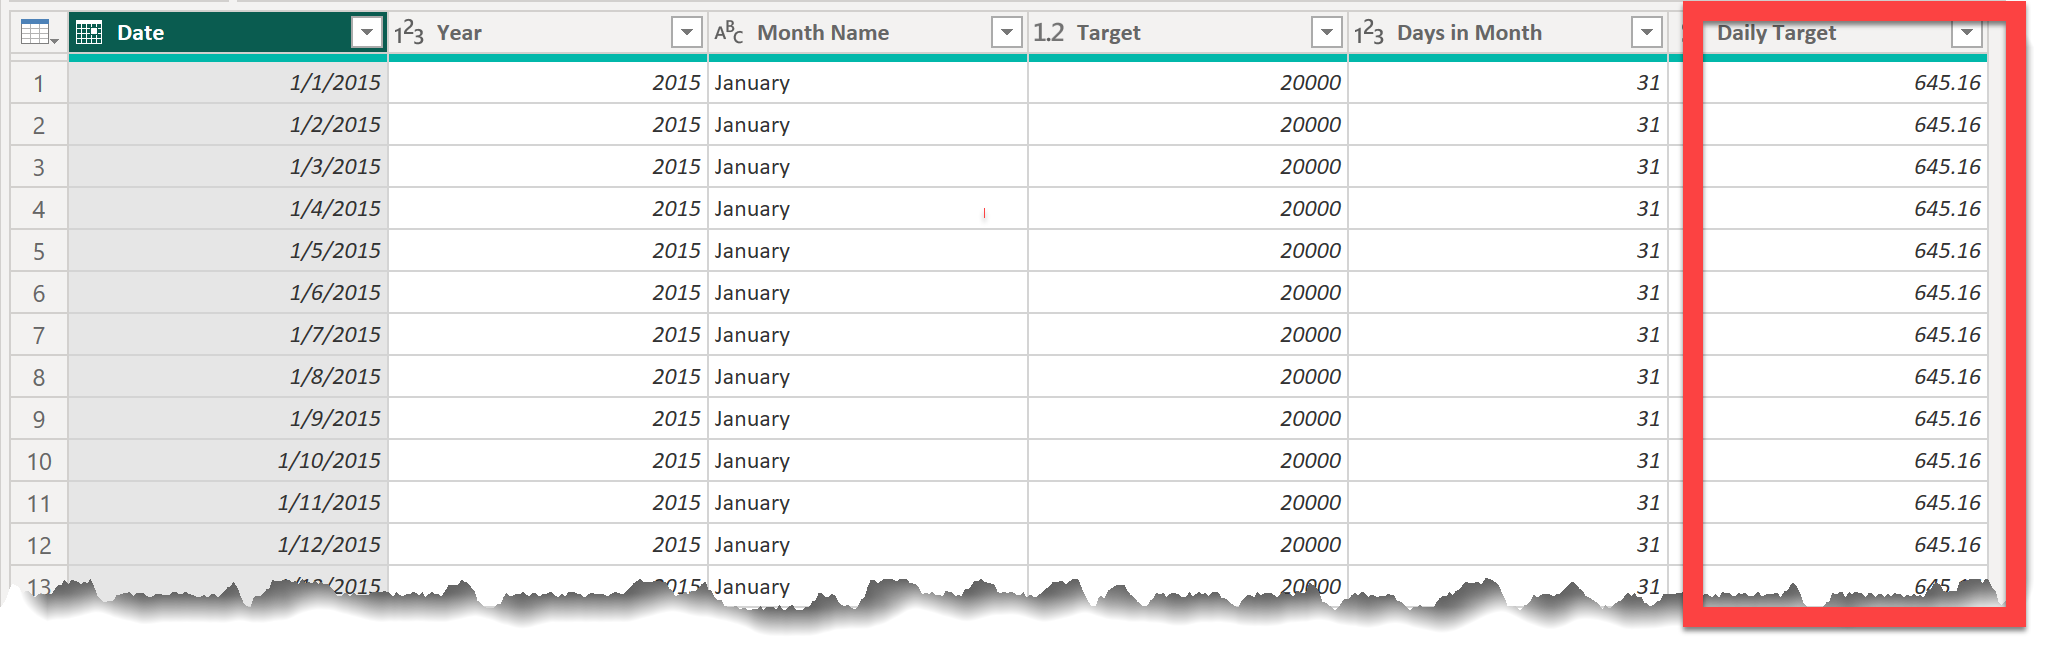
From the information above (also found in the “Monthly Targets” table in the PBIX attached), you are to add a Sales Targets table to the model that:
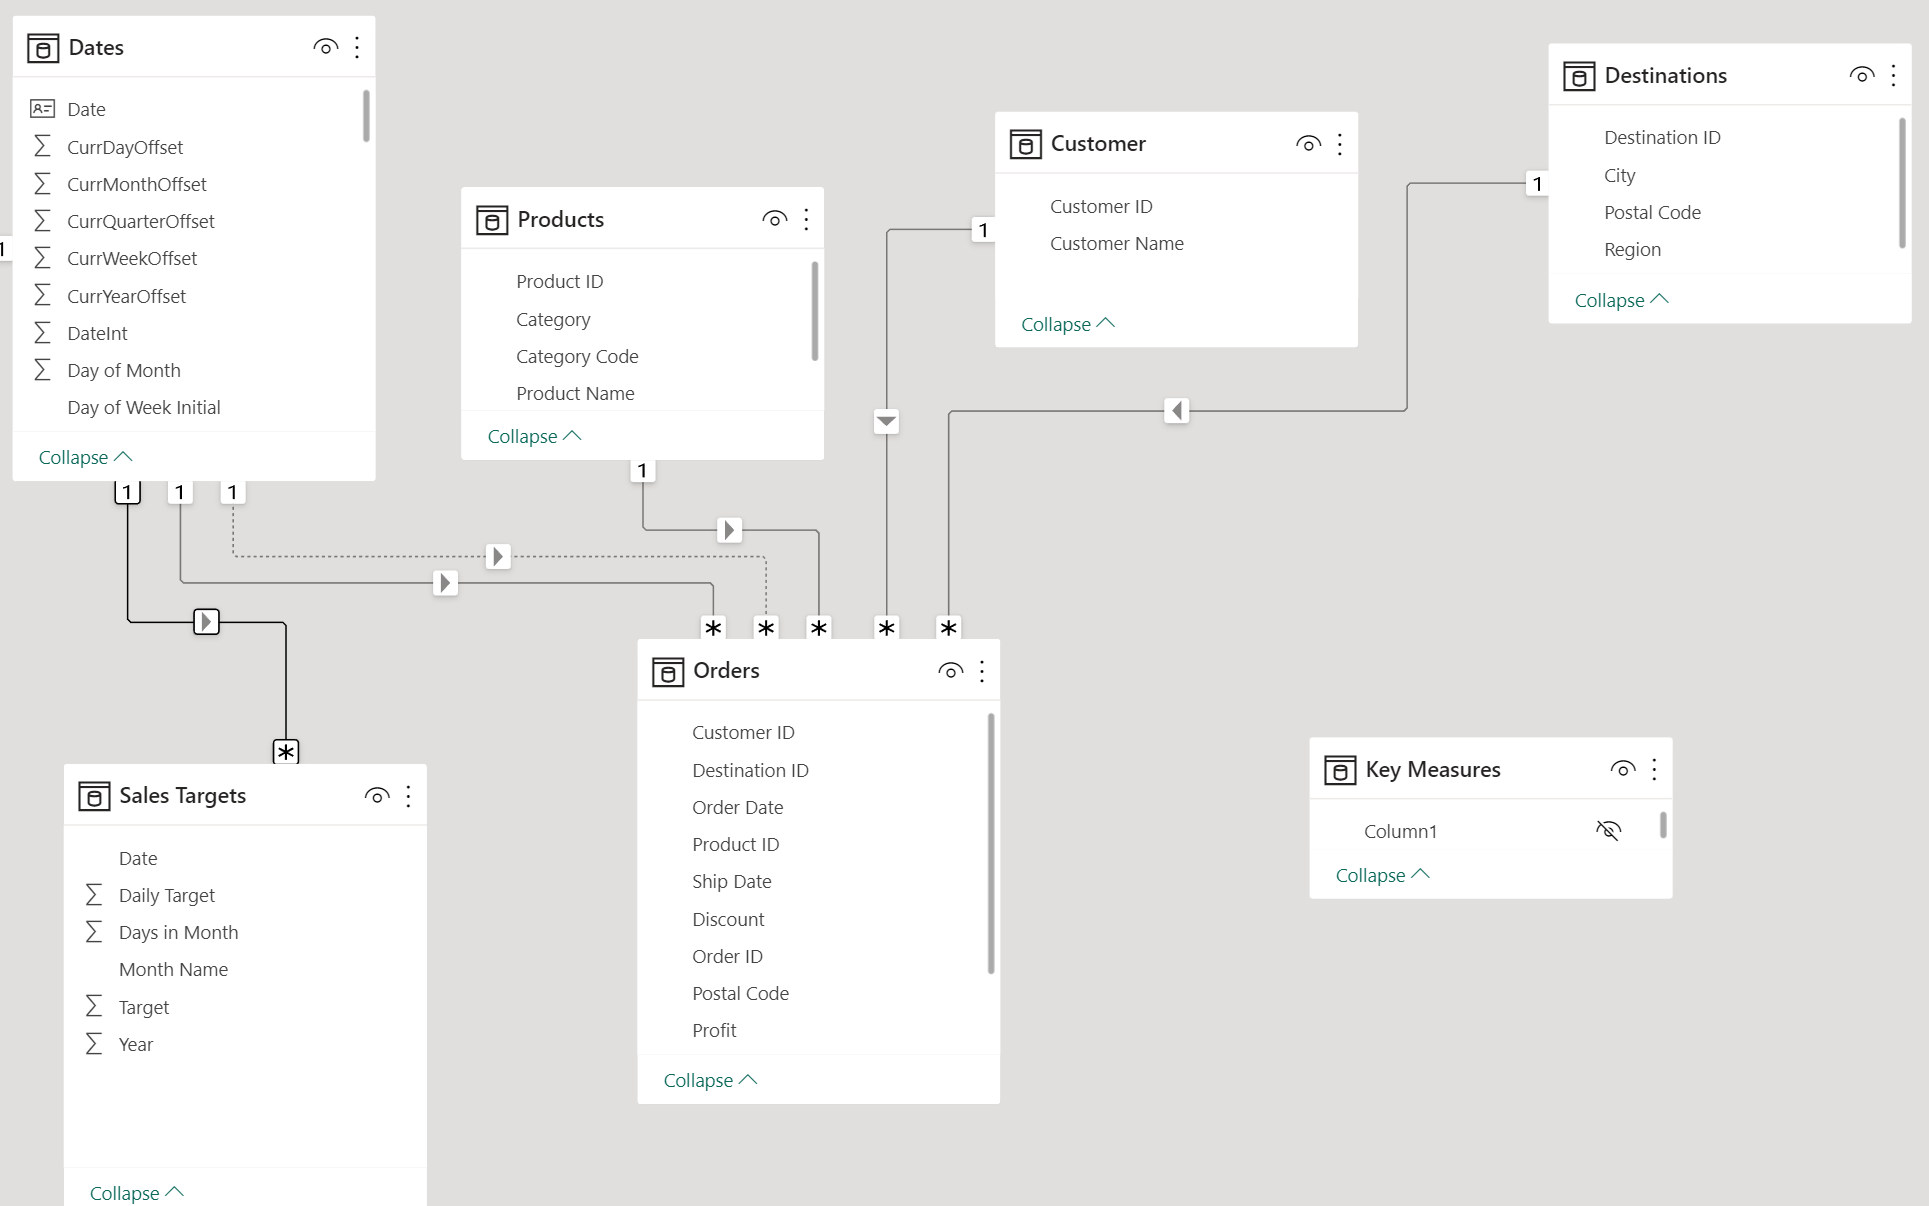
:small_orange_diamond: Is filterable by the Dates table
:small_orange_diamond:Can be used to produce the analyses below
:small_orange_diamond:Is connected by a one-to-many, unidirectional relationship (No bidirectional relationships!)

You can assume that sales are generally uniform across the days within a given month.

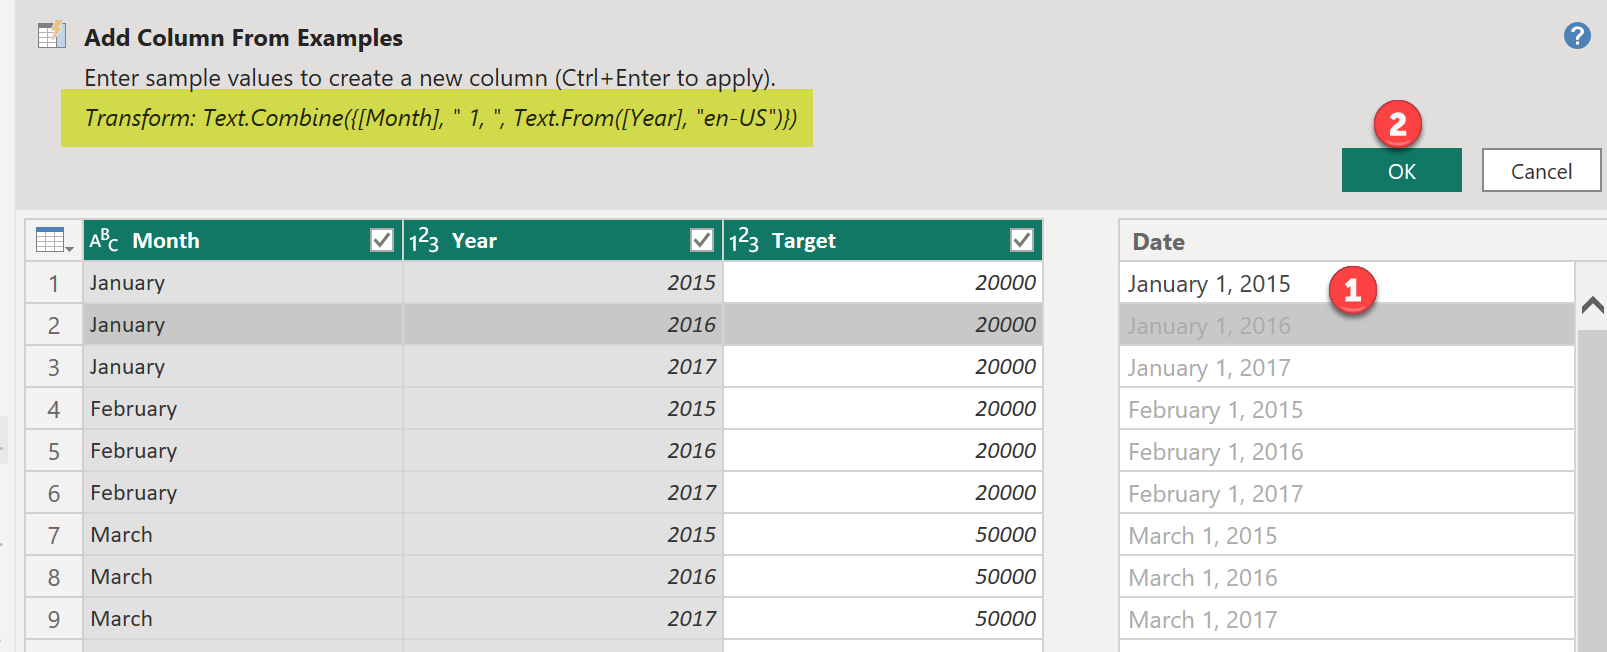
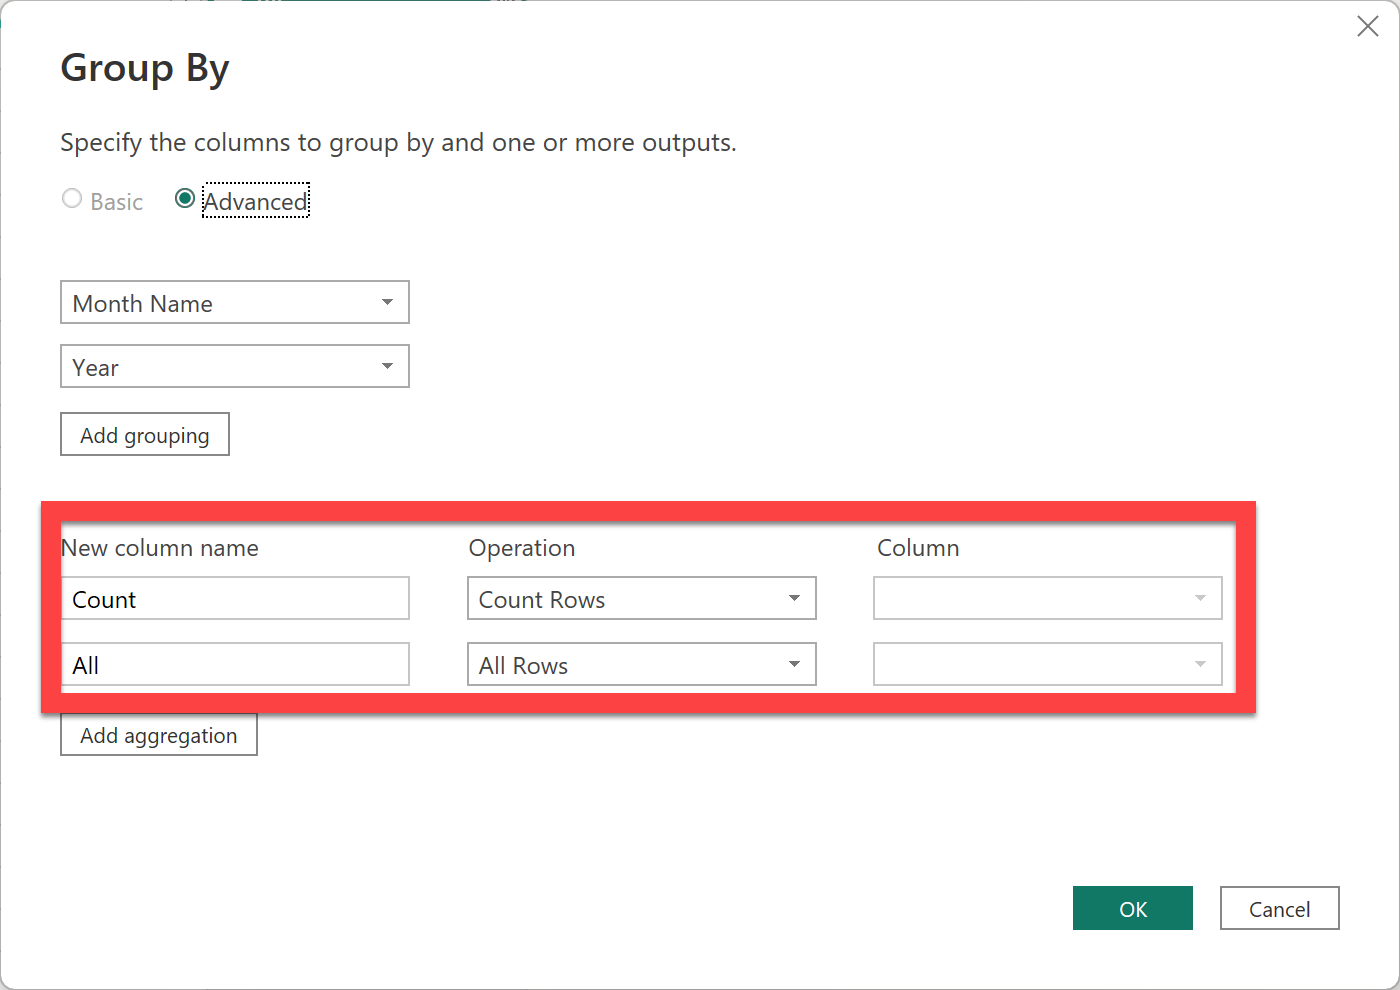
You can create the Sales Targets table however you’d like. I recommend Power Query, and I have confirmed that the Workout can be solved with no custom M code - only the UI (though feel free to use custom M if you’d like).

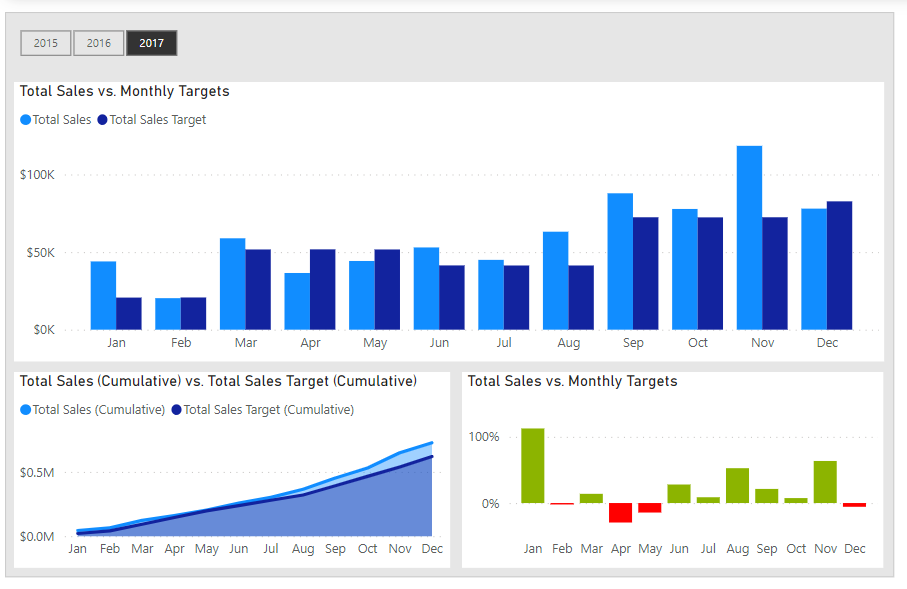
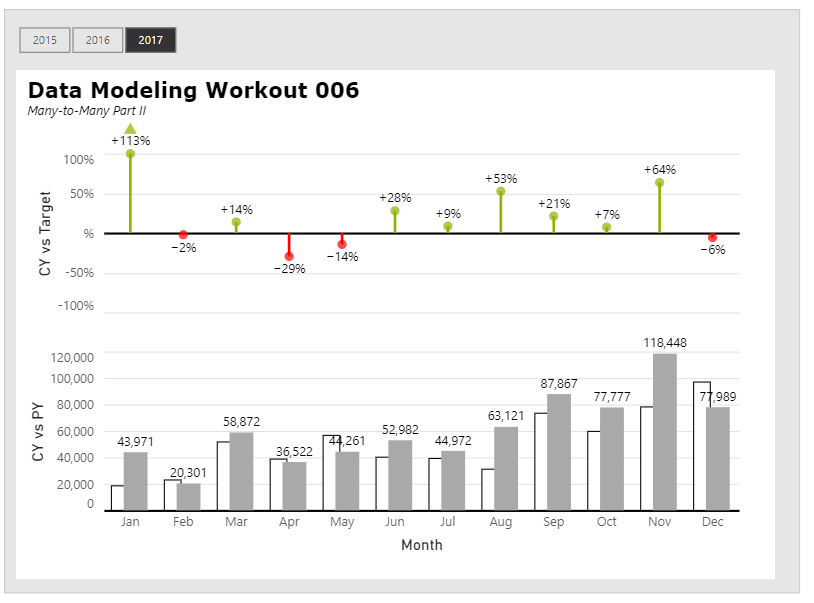
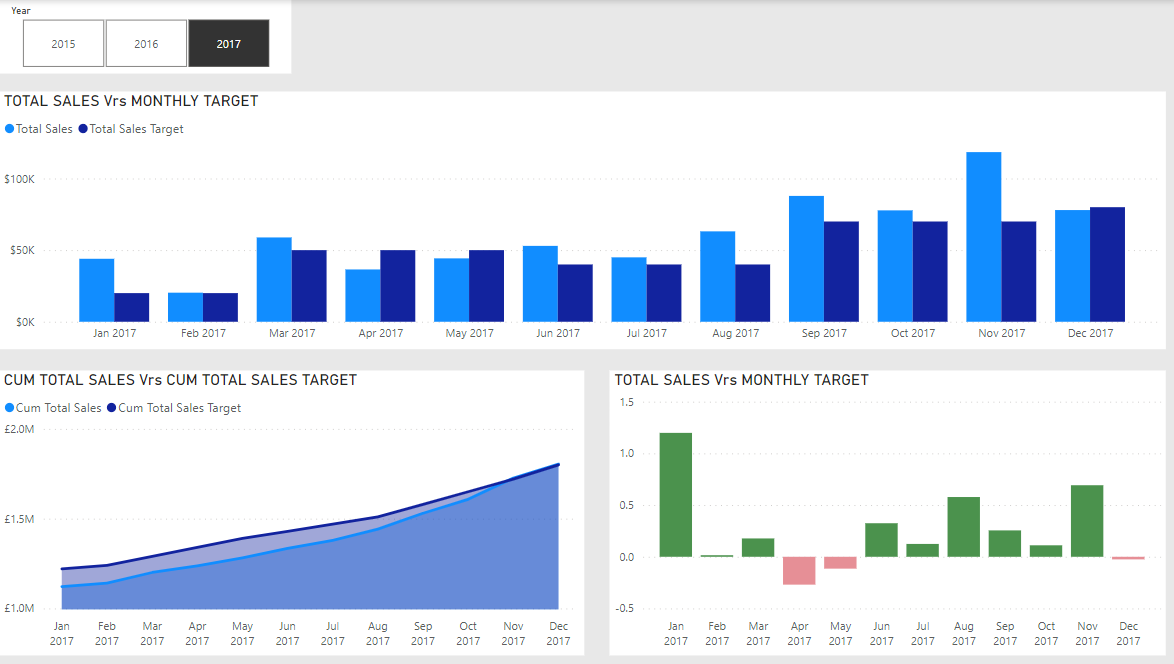
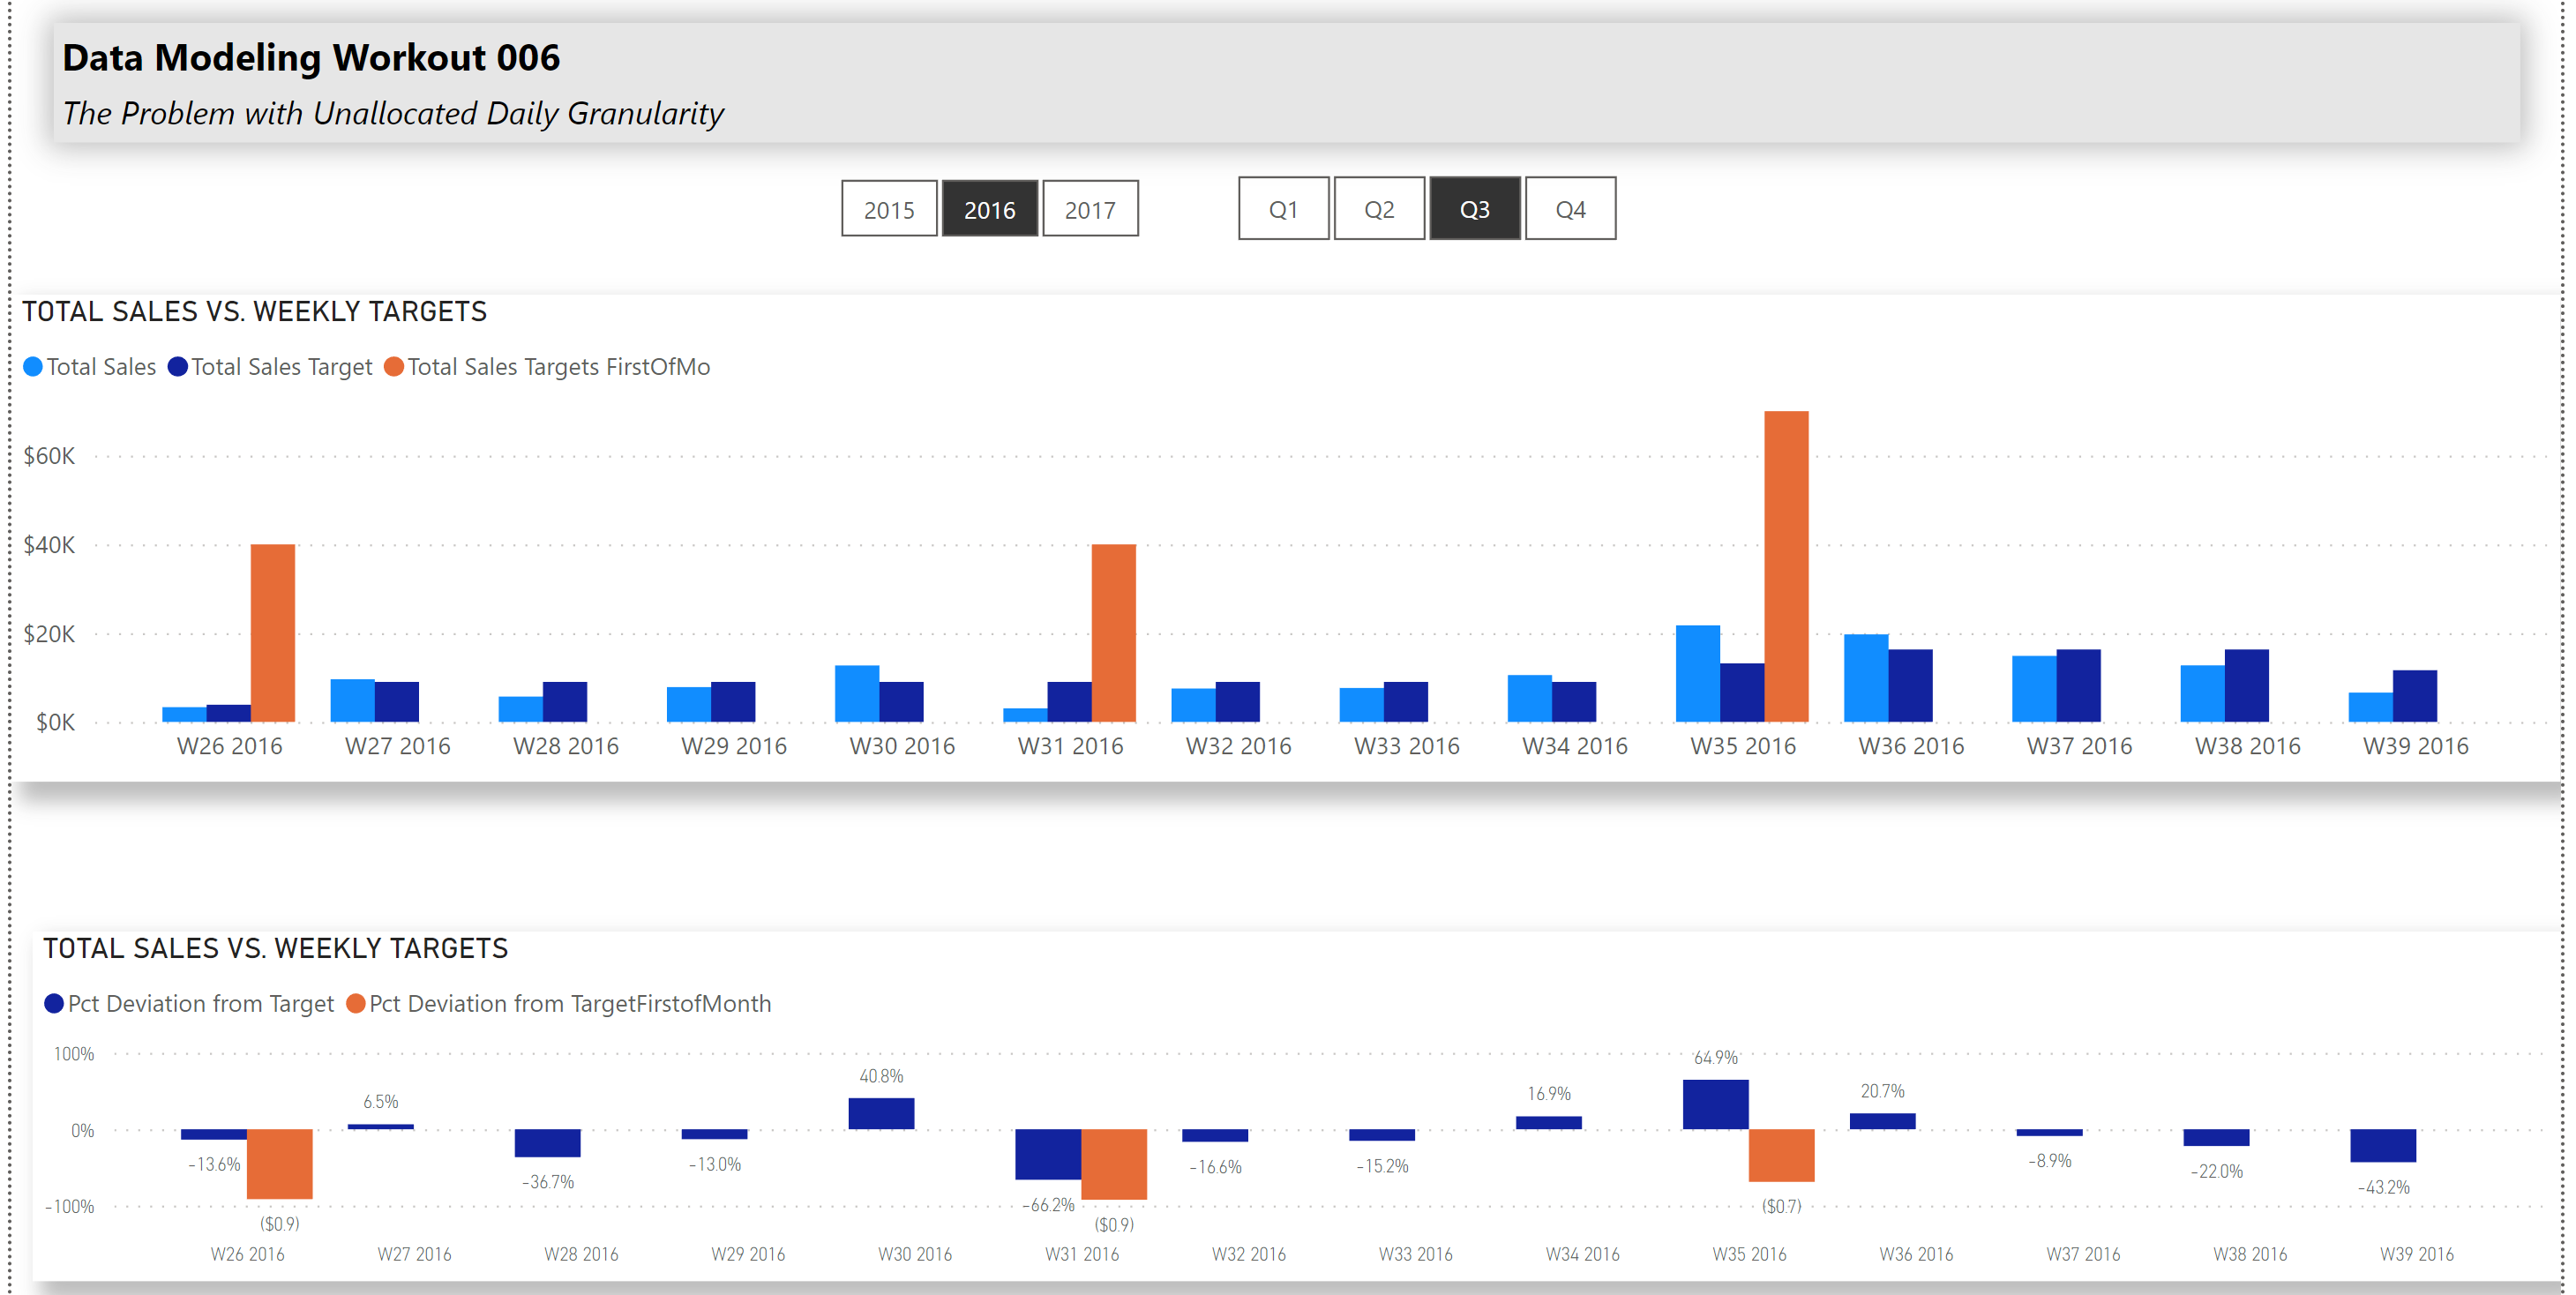
Here’s what the outcome should like when you’re done:

Data Modeling Workout 006

When you are done, please post your PBIX file, and a screenshot of your results. No need to hide anything on this one, since neither of these items will be “spoilers” for those who haven’t finished the workout yet.

Good luck!

Data Modelling Workout 006 - Many to Many Part II - Posted Workout.pbix (1.1 MB)

Data Modeling 003.xlsx (1.4 MB)

3 Likes

All,

Below is a post I did on LinkedIn tonight about this workout explaining why we think this one is a particularly important one to dive into.


Getting your data model right is the most important aspect of Power BI development, and star schema is the most important concept in data modeling. But “granularity” is a close second. Nail those two and you’re set…

Granularity refers to the level of detail or summarization of your data.

For example, think of a time series. Very “coarse” granularity might indicate data at the year or quarter level. Very “fine” granularity might be down to the minute, second, or even millisecond level.

The level of data granularity determines: 1) what analyses can be performed on the data and 2) whether the results from that analysis will lead to appropriate conclusions.

Since the finer the level of detail, the larger the amount of data in the fact table, the granularity exercise is primarily about figuring out the “sweet spot” between the level of the analysis and data size/speed.

Granularity mismatches (i.e., tables of different granularities within the same data model) if unaddressed can lead to incorrect and/or incomplete results. Addressing problems including many-to-many relationship issues within a data model often comes down to resolving these granularity mismatches.

If this all sounds a bit abstract, I hear you. It did to me too at the time. But a couple of clear, applied examples hit me like a thunderbolt, after which it all made sense, and the quality of my data models took a huge leap forward.

In this week’s Enterprise DNA Data Modeling workout, Greg Philps and I have built out a detailed, practical exercise centered on these exact concepts. We are confident that if you dedicate the time and thought to this workout it will pay you back many-fold in terms of simpler, faster models that produce the analytic results you need.

All the workouts are free to the entire community and can be found here:

Hope to see you there.

Granularity

3 Likes

@BrianJ,

Grain matching problems come up often. This workout was a helpful way to get some practice.

Here is an image from my attempt to replicate your post:

and an alternate image:

Data Modelling Workout 006 - HufferD.pbix (2.4 MB)

Thanks for spending the time to organize this!

2 Likes

@HufferD ,

Bang on - well done! Glad to hear you found this helpful.

Love the representation using the Zebra BI column chart with the variances from target.

Thanks for participating!

  • Brian

@BrianJ , Zebra BI? I’m afraid I’m honestly not familiar with that term.

@HufferD ,

Oh, wow! Zebra BI is a fantastic set of IBCS-compliant custom visuals that produces charts that look almost exactly like the ones you produced. I had just assumed that’s what you’d used for your visuals.

They have presented at a number of the eDNA summits, and we have some great content from them on the platform that is well worth checking out.

  • Brian

Ah. I see @BrianJ. I shy away from most fee-based custom visuals.

That image I showed is just a vega-lite spec.

1 Like

@HufferD … great example of a composite visual in Deneb/Vega-Lite …
Greg

1 Like

Here is my submission;

Data Modelling Workout 006 - Eze.pbix (1.1 MB)

Thanks @BrianJ for the workout, this was another good learning experience.

1 Like

Here is my submission


I don’t know if I did it right. But I just created a “Date” column for monthly target and wonder if I need to break down the target by date as @Eze.
Thanks @BrianJ and looking forward to your solution.

1 Like

Below is my submission to this problem.
Thanks @BrianJ for another great workout

Power Query

Data Model

PBIX

Data Modelling Workout 006 - Many to Many Part II - Posted Workout.pbix (1.1 MB)

1 Like

All,

Another great job done by everyone who participated. There were two different solution approaches taken. Both got to the right answer for this challenge, but one approach represents a more robust solution that you would likely apply in a real-world situation. However, we will take a look at both below, since I think the comparison is very instructive.

SOLUTION APPROACH #1 - DAILY GRANULARITY, UNALLOCATED MONTHLY TARGET

So, the problem we have is that there’s a many-to-many relationship between the Month in our Dates table and the Month in our Sales target table.

A simple solution is to assign the target for each month to an arbitrary day (for argument’s sake, we’ll use the first day of the month). Now using Add Column From Examples in Power Query, we can just add a Date Column, type in one of the dates and the system is smart enough to fill in all the rest, and to write the highlighted M code automatically. Pretty cool…

Now we just have to click OK, change the type to Date, connect it the Dates table in our model via a one-to-many relationship between Dates[Date] and FirstOfMonTarget[Date] and we’re good to go - as long as we stay at monthly granularity or coarser.

However, if we go to weekly or finer grain, things go seriously sideways:

This is because the entire sales target is being allocated to the first day of each month and there is no target present for any of the other days. This means over the course of the month the sales will tally daily, but the total target will be unchanged from the first day. On the final day of the month, the sales will hopefully be close to the target, but cumulatively they will always be the furthest apart on the first day of each month. This is why this solution is not recommended - it does not accurately reflect the way sales accure to a total target over time. This inaccuracy is masked at monthy or coarser granularity.

SOLUTION APPROACH #2 - DAILY GRANULARITY, ALLOCATED MONTHLY TARGET

To solve that problem, we need not just join the tables together at a common daily granularity, but also allocate the monthly target figures down to the daily level. Once we do that, we can aggregate the daily target amounts UP to any coarser granularity using a simple SUM measure - the exact same way we do so for Total Sales.

So, how do we do this? The easiest way is just to duplicate our Dates table, keeping only the columns for Date, Monthname and Year. Note that we DUPLICATE the Dates table, NOT Reference it. This is because if we reference the Dates table to create the Target table, it will throw a circular dependency error if/when we make changes. By Duplicating, the system just repeats the M code script that created the Dates table and uses those same steps to create the Daily Target table. Both tables are now independent and can be changed and connected with the data model when completed with no problems.

We can now take that Daily Sales Target table and merge it with the Monthly Targets table to look up the targets for each month.

Expand and select the Target field, and we are looking good.

Now, we just need to allocate the monthly Target down to the daily level, and we’ll be all set…

Because we are assuming that Sales accrue uniformly throughout the month, we can allocate our monthly Target down to the daily level just be counting the number of days in each month each year.

A simple UI-based was to do that is with the PQ Group functioni. We aggregate on Year and Month, and then use the following Group By structure

The important thing here is to not only to count the rows associated with each Month, but to retain all rows, so that we can expand back to the daily granularity after the calculation is done.

Once we do that, all we need to do is divide the Monthly target by the number of days in the month and we’ve got our daily allocated sales targets.

Now if we like, we can select columns and deselect the Target (monthly) column and the Days in Month, join this table to our Dates table via a 1-to-Many relationship, and we’re all set and ready to go with a proper star schema all at the daily granularity.

From here, we can just contruct the specified visuals as we normallly would.

We hope you found this Workout helpful. Personally, this is the approach I use for almost every granularity mismatch problem I encounter, since with a little up-front work, you retain a simple star schema model that works beautifully with just simple DAX.

We’ll be back tommorow with Part III of IV in this series, which looks at more complex allocation strategies that perhaps better mirror the patterns of sales accruals in a given period.

Thanks again for participating and hope to see you back again in Workout #007!

  • Brian

Data Modelling Workout 006 - Many to Many Part II - Brian Julius Solution Expanded2.pbix (748.8 KB)

5 Likes

Finished workout 6. Don’t think I have any questions on this one.


Data Modelling Workout 006 - Many to Many Part II - kenneth.pbix (1.1 MB)

Summary

This text will be hidden