import pandas as pd
import io
import matplotlib.pyplot as plt
from prettytable import PrettyTable
# Read the uploaded file into a DataFrame
df = pd.read_csv(io.BytesIO(uploaded['netflix_titles.txt']))
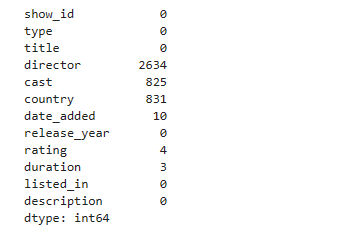
# Check for missing data and deal with them
print(df.isnull().sum())
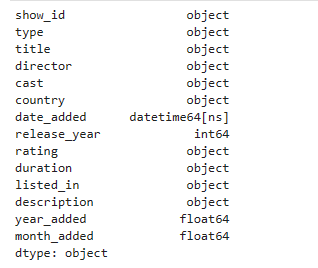
# Convert 'date_added' to datetime type
df['date_added'] = pd.to_datetime(df['date_added'])

# Create the new columns
df['year_added'] = df['date_added'].dt.year
df['month_added'] = df['date_added'].dt.month
print(df.dtypes)
# Fill missing values with -1 (indicating missing data)
df['year_added'].fillna(-1, inplace=True)
df['month_added'].fillna(-1, inplace=True)
# Convert columns to integers
df['year_added'] = df['year_added'].astype(int)
df['month_added'] = df['month_added'].astype(int)
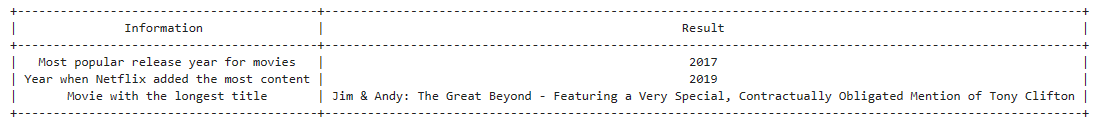
# What is the most popular release year for movies on Netflix?
# What year did Netflix add the most content to its platform?
# What is the movie with the longest title in the dataset?
popular_release_year = df[df['type'] == 'Movie']['release_year'].value_counts().idxmax()
most_content_year = df['year_added'].value_counts().idxmax()
longest_title_movie = df[df['type'] == 'Movie']['title'].str.len().idxmax()
# Specify the Column Names while initializing the Table
summary_table = PrettyTable(["Information", "Result"])
# Add rows
summary_table.add_row(["Most popular release year for movies", popular_release_year])
summary_table.add_row(["Year when Netflix added the most content", most_content_year])
summary_table.add_row(["Movie with the longest title", df.loc[longest_title_movie, 'title']])
print(summary_table)
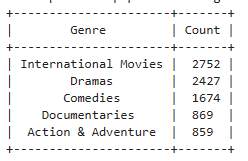
# What are the top 5 most popular movie genres?
# Create a DataFrame of the top 5 most popular movie genres.
genres_df = pd.DataFrame(df[df['type'] == 'Movie']['listed_in'].str.split(', ', expand=True).stack().value_counts().nlargest(5), columns=['Count'])
genres_df = genres_df.reset_index()
genres_df.rename(columns = {'index':'Genre'}, inplace = True)

# Initialize the PrettyTable
genres_table = PrettyTable(["Genre", "Count"])

# Add rows to the table using a for loop
for index, value in genres_df.iterrows():
     genres_table.add_row([value['Genre'], value['Count']])

print("The top 5 most popular movie genres are:")
print(genres_table)
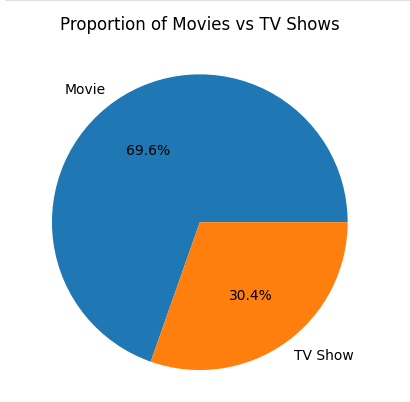
# Create a pie chart visualizing the proportion of movies vs TV shows. Label each section with the percentage.
content_type_counts = df['type'].value_counts()
plt.pie(content_type_counts, labels = content_type_counts.index, autopct='%1.1f%%')
plt.title('Proportion of Movies vs TV Shows')
plt.show()
import pandas as pd

# Load the dataset
url = 'https://raw.githubusercontent.com/kedeisha1/Challenges/main/netflix_titles.csv'
df = pd.read_csv(url)

# Check for missing data
missing_data = df.isnull().sum()
print(missing_data)

# Create 'year_added' column
df['year_added'] = pd.to_datetime(df['date_added']).dt.year

# Create 'month_added' column
df['month_added'] = pd.to_datetime(df['date_added']).dt.month

# Check data types
print(df.dtypes)

# Filter movies only
movies_df = df[df['type'] == 'Movie']

# Count occurrences of each release year
popular_release_year = movies_df['release_year'].value_counts().idxmax()

print("The most popular release year for movies on Netflix is:", popular_release_year)

# Count occurrences of each year_added
most_content_year = df['year_added'].value_counts().idxmax()

print("The year when Netflix added the most content is:", most_content_year)

# Find the movie with the longest title
longest_title_movie = df.loc[df[df['type'] == 'Movie']['title'].str.len().idxmax()]['title']

print("The movie with the longest title is:", longest_title_movie)

# Split the genres column and count occurrences
genres_counts = df['listed_in'].str.split(', ').explode().value_counts()

top_5_genres = genres_counts.head(5)

print("Top 5 most popular movie genres:")
print(top_5_genres)

import matplotlib.pyplot as plt

# Count the occurrences of movies and TV shows
type_counts = df['type'].value_counts()

# Create the pie chart
plt.pie(type_counts, labels=type_counts.index, autopct='%1.1f%%')
plt.axis('equal')
plt.title('Proportion of Movies vs TV Shows')
plt.show()