Hi All,
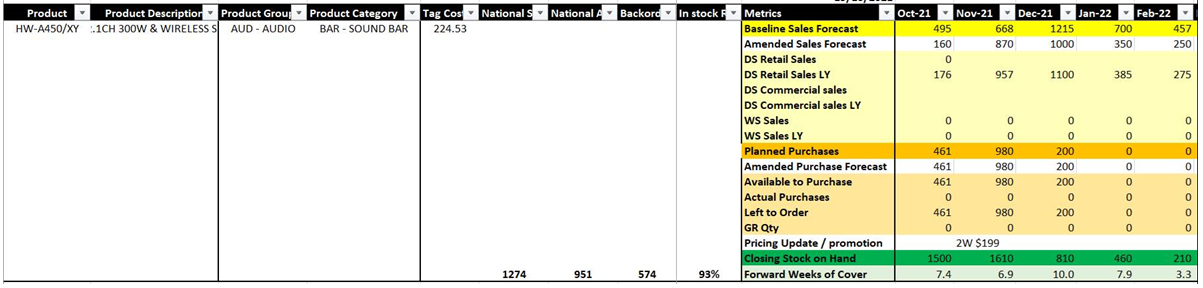
I’m having difficulty in creating a visualisation like below. I have hundreds of product codes and for every product code i need the ‘Metrics’ column next to each product code. I have attempted to do this with the table visualisation with no luck and im assuming the matrix visualisation is the best option here.
The main difficulty im having is having that blank space and also transposing the ‘Metrics’
Thank you All
Joseph
Hi @joseph.chang, I noticed you didn’t provide a PBIX file. Providing one will help users and experts find a solution to your inquiry faster and better.
A perfect initial question includes all of the following:
- A clear explanation of the problem you are experiencing
- A mockup of the results you want to achieve
- Your current work-in-progress PBIX file
- Your underlying data file (to allow us to go into Power Query if necessary to transform your data and/or data model – often DAX questions really end up being data modeling solutions)
Check out this thread on Tools and Techniques for Providing PBIX Files with Your Forum Questions
Not completing your data may sometimes cause delay in getting an answer.
Hello @joseph.chang, welcome to the forum again 
This is a gentle follow up for your PBIX File.
Here are some videos that may help you masking sensitive data and create datasets and data models representative of your problem:
Hi @joseph.chang, we’ve noticed that no response has been received from you since October 20.
We waited for the masked demo pbix file and any other supporting links and details. Due to inactivity, we’ll be tagging this post as Solved.