Cumulative Totals Not Working-

Hi,

I am developing a cumulative total for the attached model, i have different forecast and actual versions.

My cumulative total works for 2020 Budget and 2020 Forecast but does not work for Prior Year 2019.

i have created three total sales formula= Current year forecast, Current year budget and Prior year actuals. I am now trying to run the cumulative totals for the three total sales measures.

i am using dateadd ( allselected) in the cumulative sales formula. What i am not able to crack is it works for Current year budget and forecast when i select year 2020. and Prior year works when i select year 2019. But when i select both the year it does not work for the Prior year actuals.

my selection slicer year is 2020 and 2019

May i know where i am going wrong.
Appreciate your help.

regards
KrishBI Time Intelligence Issue.xlsx (9.3 KB)
attached model.

Can you please add a pbix file not excel file. Thanks

Hi @krish1712, we aim to consistently improve the topics being posted on the forum to help you in getting a strong solution faster. While waiting for a response, here are some tips so you can get the most out of the forum and other Enterprise DNA resources.

  • Use the forum search to discover if your query has been asked before by another member.
  • When posting a topic with formula make sure that it is correctly formatted to preformated text </>.
  • Use the proper category that best describes your topic
  • Provide as much context to a question as possible.
  • Include demo pbix file, images of the entire scenario you are dealing with, screenshot of the data model, details of how you want to visualize a result, and any other supporting links and details.

I also suggest that you check the forum guideline https://forum.enterprisedna.co/t/how-to-use-the-enterprise-dna-support-forum/3951. Not adhering to it may sometimes cause delay in getting an answer.

Attached pbix fileBI Time Intelligence Issue.pbix (123.0 KB)

Hi,

I managed to fix it by applying SAMEPERIODLASTYEAR dax formula to the total sales since that would be the same as PY actuals. I then iterated using Calculate and Filtering it with Allselected dates on the Sameperiodlastyear sales and it worked.

but what i am unable to understand is when i use multiple years in the slicer it should work with the Calculate (PY actuals and applying filter on Allselected dates.).

i am not sure what i am missing, but for now i solved temporarily. I am on the learning curve and enjoying it every bit.

regards
Krish

@krish1712,

I think I’ve reworked this correctly If I understand your requirement properly. The totals and cumulative totals now calculate correctly whether one year or both are selected.

image

Here are the changes I made:

  1. marked your date table as a date table

  2. what you had functioning as a slicer was actually a table, so I changed it to a slicer

  3. sorted the row header in the visual chronologically

  4. changed your previous year calculation from filtering on Version to a true time intelligence-based filter on year using the DATEADD function

  5. using measure branching from 4) above, updated the cumulative PY measure

    Total Sales PY =

     CALCULATE(
         [Total Sales], 
         DATEADD(
             'Date'[Date],
             -1,
             YEAR
         )
     )
    

Cumulative Sales PY =

CALCULATE(
    [Total Sales PY], 
    FILTER(
        ALLSELECTED( 'Date' ), 
        'Date'[Date] <= MAX('Date'[Date] )
    )
)

I hope this is helpful. Full solution file attached below.

Hi Brian,

Thanks a lot, i am on the learning curve now, everyday is pretty exciting learning BI given the lockdown.

I need few clarifications, i have the versions which is the Budget, Forecast and PY Actuals which is how my financial model is, how can i get the PY actual in the same table cumulatively with the Budget and Forecast cumulatively. I tried with the slicer and it did not work.

Your formula works for Total Sales but when will it apply for the versions as well. Maybe these are simple questions but i am learning.

regards
Krish

@krish1712,

Trust me, everyone who works with Power BI Is still on the learning curve. :wink:

I’ve read your most recent message over couple of times and I’m still having trouble visualizing the result you want. If you can please provide a mockup of exactly what you’re looking for in the resulting visual(s), I’m pretty sure it will be a fairly straightforward tweak of our current structure/measures.

Thanks.

  • Brian

Hi Brian,

Ok, let me apply and send it to you.

regards
Krish

Hi Brian,

Attached file, see page 2, this is where i am struggling, why i am not able to see even when i am using 20 and 19 slicer for PY Actual cumulatively.

Where i am going wrong.

I created new measures using Filters for various financials version, since my aim is to compare the deviation between PY, Forecast and budget, i created separate sales measures using filters.

Appreciate your guidance.

regards
krishBI Time Intelligence Issue Solution (1).pbix (111.4 KB)

@krish1712,

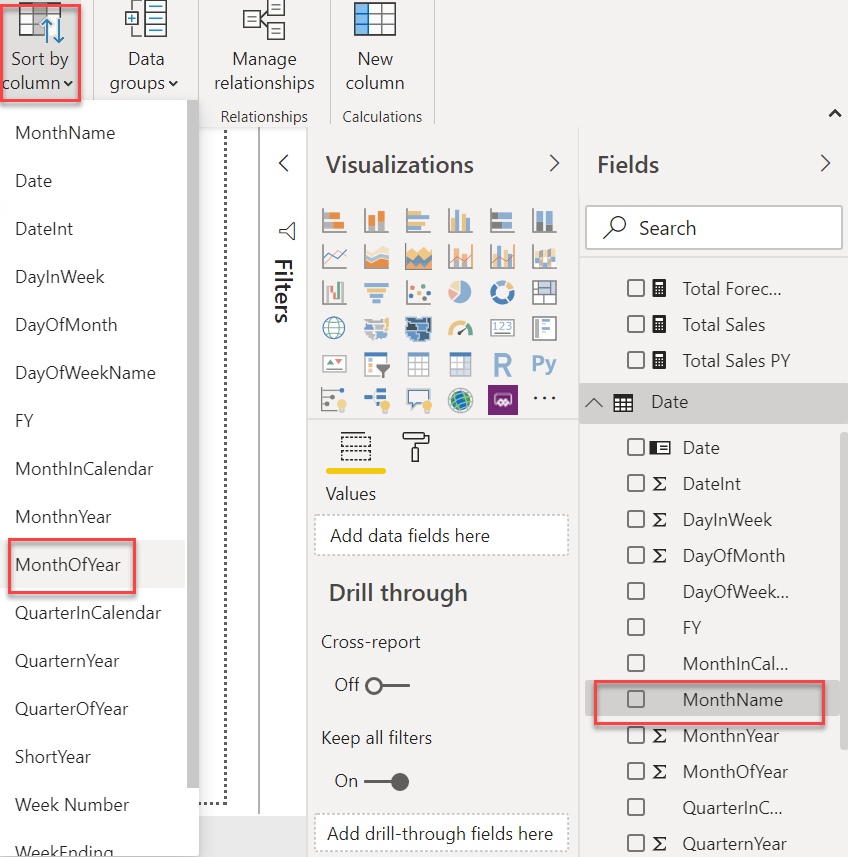
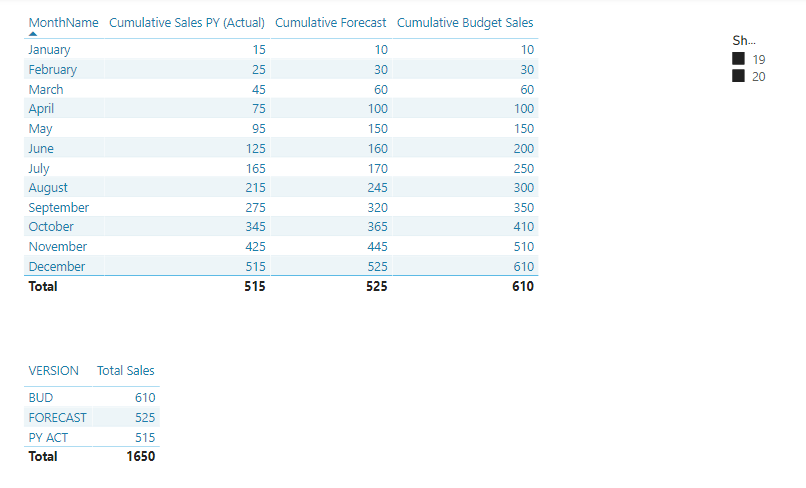
Nice job on the revision. You were soooo close - your cumulative totals were actually correct, but just looked wrong because you had your row headers sorted incorrectly. When you sort MonthName by MonthOfYear, It all snaps into place:

P.S. If you don’t mind, can I make a suggestion that I guarantee will serve you well as you progress with Power BI - learn to format your DAX, and do it on every measure that you write.

Look how much simpler it is to read and understand this measure formatted versus unformatted:

Cumulative Sales = 

CALCULATE(
    [Total Sales], 
    FILTER(
        ALLSELECTED( 'Date' ), 
        'Date'[Date] <= MAX('Date'[Date] )
    )
)

Cumulative Sales = CALCULATE([Total Sales], FILTER(ALLSELECTED(‘Date’), ‘Date’[Date]<=MAX(‘Date’[Date])))

And as you start writing more complex measures with variables, virtual tables, etc. the difference gets even more pronounced, and at least IMO understanding and debugging a complex unformatted measure is 10 times harder than doing the same thing for a formatted one. Daxformatter.com is a terrific site that will automatically format your DAX measures. It’s a great learning tool, but once you get used to formatting as you write measures, you’ll find that you rarely use or need it anymore.

1 Like

Hi Brian,

Thanks and appreciate it. Yes, i will use it going forward.

I agree with you completely.

Appreciate your help, hopefully with the forum support i will be getting there.

regards
Krish

I hope that you are having a great experience using the Support Forum so far @krish1712. Please don’t forget if your question has been answered within the forum it is important to mark your thread as ‘solved’. Also, we’ve recently launched the Enterprise DNA Forum User Experience Survey, please feel free to answer it and give your insights on how we can further improve the Support forum. Thanks!