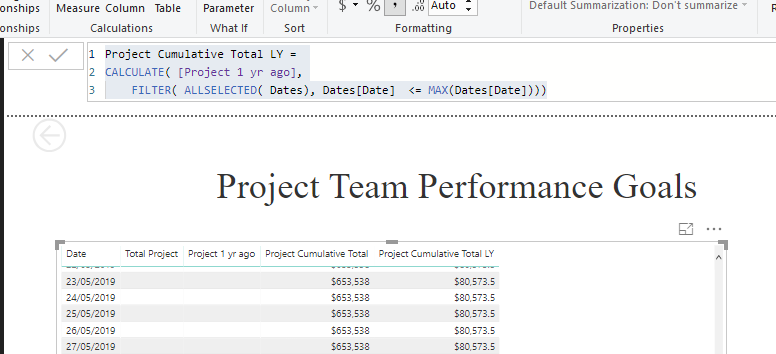
One thing to do here is always place formulas into tables first so you can see the results. This way you’ll know if it’s the formula which is the issue.
The issue you have here is simple…you don’t have a date table.
You must always have one. All time intelligence functions are optimized to work over date tables, not the dates within your fact tables.
See below.
http://portal.enterprisedna.co/courses/103686/lectures/1772347
I’ve added one in here, then created the relationship
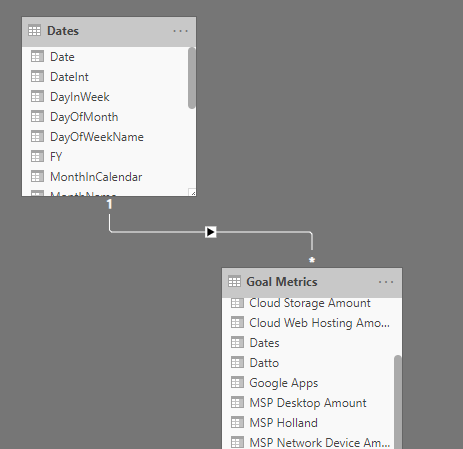
Then change all your formulas over
Project 1 yr ago = CALCULATE([Total Project], DATEADD( Dates[Date], -1, YEAR))

Project Cumulative Total =
CALCULATE([Total Project],
    FILTER( ALLSELECTED( Dates), Dates[Date]  <= MAX(Dates[Date])))


Project Cumulative Total LY =
CALCULATE( [Project 1 yr ago],
    FILTER( ALLSELECTED( Dates), Dates[Date]  <= MAX(Dates[Date])))
Things start changing up a lot now with your results, as it should.
You must also make sure all the filters from dates come from the date table. For example…
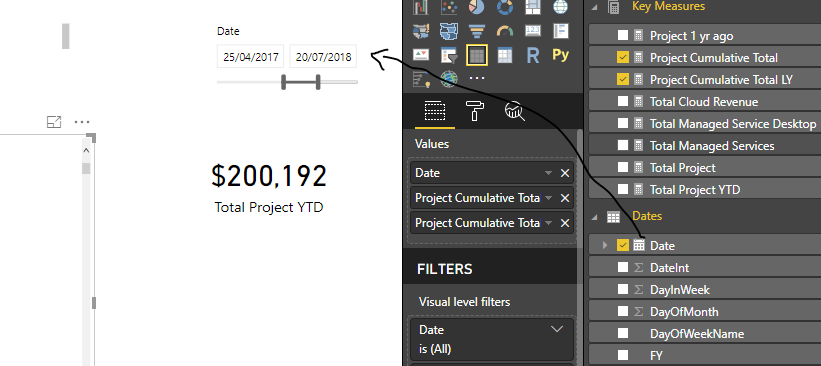
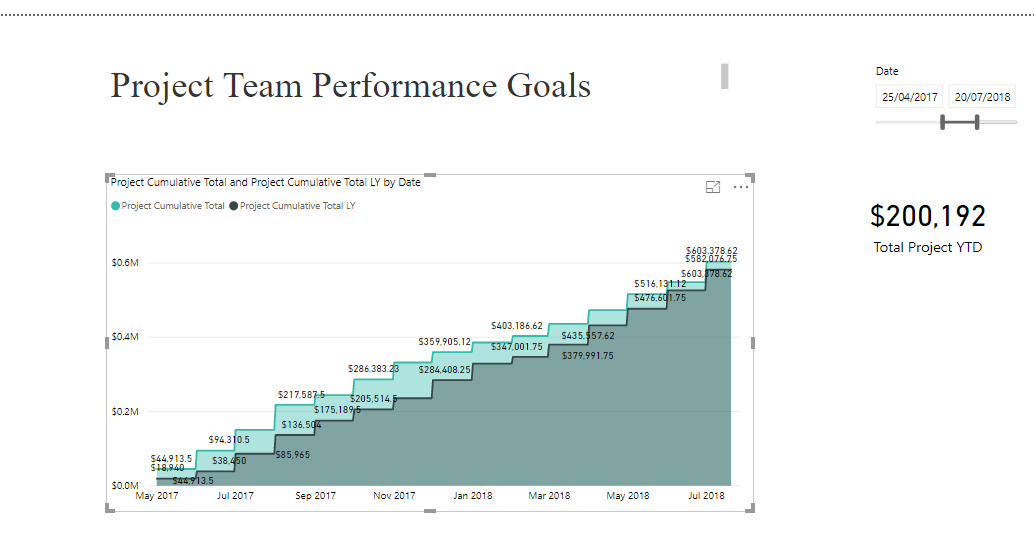
Now your charts will now work as they should also.
I’ve attached.
2019 BI Goals.pbix (169.3 KB)
Thanks
Sam