I am trying to create a dynamic table using selected value from a slicer but not able to.
I have inactive relationships between dates and HRdata where i have join date and separation date. Need to create a table of joiners using the year in slicer.
New table >>Joiners = calculatetable( summarise(HRdata, HRdata empname, HRdata desig) HRdata join YR = [selected year]).
Pls help.
Welcome to the forum! It’s a great community, and we’re glad to have you here.
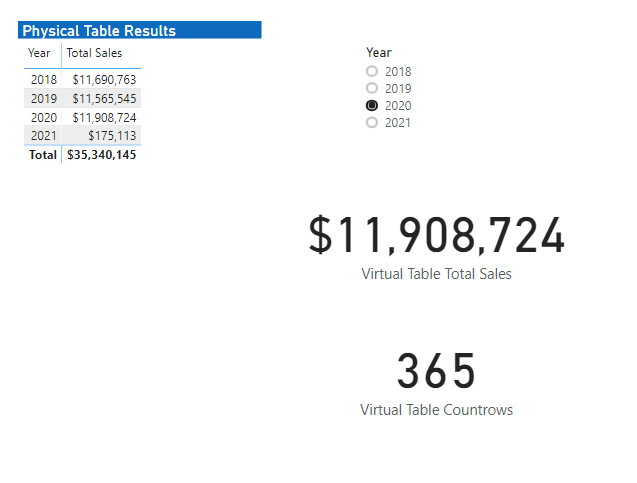
Unfortunately, Power BI does not allow you to create a physical table from a slicer. However, you can do this virtually via a measure. I worked up the following example that just creates a two column virtual table composed of Sales Date and Total Sales, filtered by the selected year from the slicer. The first measure returns the total sales for the selected year, the second measure goes through the identical virtual table manipulations, but then returns the number of rows in the virtual table via COUNTROWS().
Virtual Table Total Sales =

VAR vTable =
ADDCOLUMNS(
    SUMMARIZE(
        Sales,
        Sales[Sales Date]
    ),
    "TotSales", [Total Sales]
)

VAR vTable2 =
CALCULATETABLE(
    vTable,
    FILTER(
        vTable,
        YEAR( Sales[Sales Date] ) = [Harvest Year Slicer]
    )
)

RETURN
SUMX(
    vTable2,
    [Total Sales]
)
Here’s what it looks like all put together:
Hope this is helpful. Full solution file posted below.
- Brian
eDNA Forum - Virtual Table From Slicer.pbix (511.9 KB)
P.S. I didn’t see @uriah1977’s post until after I posted mine, but he is spot on - you will always get a better, more specific response if you post your PBIX file with your question, and it also makes it easier for the people responding.
2 Likes
OK, that really helps clarify things. What you’re looking for is not a virtual table, but a dynamic table visual(s) that updates via a slicer - that is a task that power BI handles well.
The approach I took (full solution file attached below) was first to create two measures to harvest the min and max dates for the year selected in the slicer:
Min Selected Date =

CALCULATE(
    MIN( Dates[Date] ),
    ALLSELECTED( Dates[Date] )
)
I then created two more measures to list the joiners and leavers, based on the selected date range from the slicer:
Joiner List =

CALCULATE(
    SELECTEDVALUE( HRData[RPT_NAME] ),
    USERELATIONSHIP( Dates[Date], HRDATA[JOIN_DATE] ),
    FILTER(
        HRData,
        HRData[JOIN_DATE] >= [Min Selected Date] &&
        HRData[JOIN_DATE] <= [Max Selected Date]
    )
)
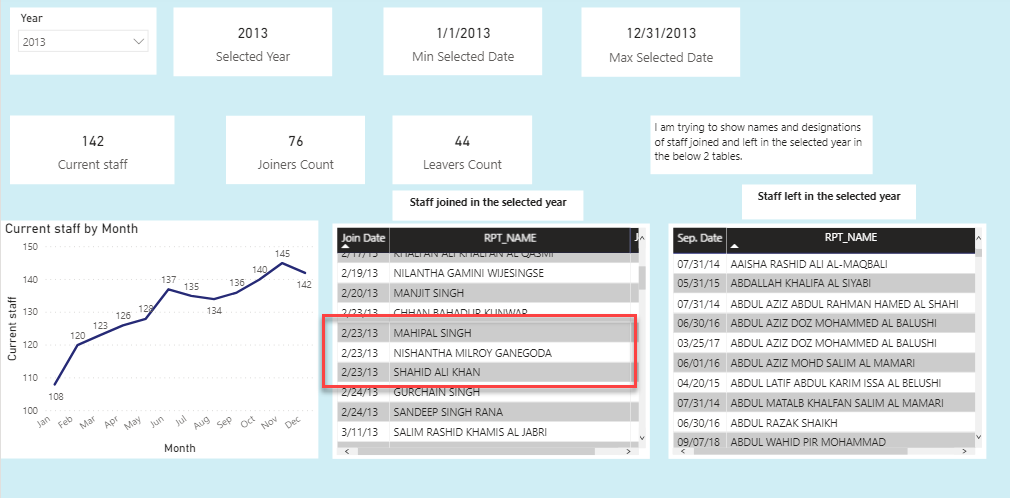
Now just drop join date into your table visual for evaluation context, add the [Joiner List] measure and you’re in business:

- Brian
eDNA Forum Post - HR Sample solution.pbix (241.9 KB)
A couple of great videos on the principles used above:
Thanks for the quick reply Brian, However I am not getting the correct data for all years, example, if there are more than 1 employee with same date of join. Is there an alternative option to use switch function?
Good catch. Let’s try this instead - iterate through all the employee names, and mark with a 1 all those with a join date that falls within the selected date range. Then set the filter panel to show only those employees marked with a 1:
Joiner Mark =
CALCULATE(
    IF(
        SELECTEDVALUE( HRData[JOIN_DATE] ) >= [Min Selected Date] &&
        SELECTEDVALUE( HRData[JOIN_DATE] ) <= [Max Selected Date],
        1, 0
    ),
    VALUES( HRData[RPT_NAME] ),
    USERELATIONSHIP( Dates[Date], HRData[JOIN_DATE] )
)
This now picks up multiple employees with the same join date:
if this works for you, you can employ the same strategy for separation date.
Hope this is helpful.
- Brian
eDNA Forum Post - HR Sample solution2.pbix (238.4 KB)
Hi @mathew, we’ve noticed that no response has been received from you since January 27, 2020. We just want to check if you still need further help with this post? In case there won’t be any activity on it in the next few days, we’ll be tagging this post as Solved. If you have a follow question or concern related to this topic, please remove the Solution tag first by clicking the three dots beside Reply and then untick the checkbox. Thanks!
Hi @user , you may also want to check this video where Sam talked about Dynamic Grouping Via Support Tables. You might get additional tips here.
Hello @BrianJ ,
I have quite similar task with that you have solved in your post.
Here you calculated a Measure “Joiner mark” and used it in the visual element to filter unnecessary rows out. This works fine as a visual.
BUT I need to make SUMMARIZE and later TOPN with such “Joiner list” table filtered by a slicer to group them and show only TOP 5 groups.
I searched in the forum, but unfortunately haven’t found any solution for it.
Can you advise if this is possible?
thank you in advance.
Alexander
1 Like
Hi @Alexander1 as this post is already solved, can you post your question as a new post please.
Feel free to link in this post if you feel it is relevant, but if you want to get your question answered quicker then it will be much easier for people to find if you create a new post rather than in one that is tagged as solved.
DJ
Hello Davie,
yes, I’ve created a new topic: Create new dynamic table using selected value from slicer - Continue of the topic.
Hope some ideas will come up.
thanks
Alexander
1 Like