Hi guys
I am coming to the end of project building a Management Accounting model Thanks to everyone at DNA who has helped me learn this software over the last 12 months!
We still have a requirement to pdf out reports to 3rd parties and to some of our staff who will not be licenced to use pbi. I have tried numerous methods (paginated reports, SSRS etc) and returned to exporting data from pbi desktop to excel. Whilst you pbi purists will be laughing now it works for me LOL!
My excel query is an evaluate - summarize columns thing which can and has been set up in pbi model, as a dax table. It takes a minute or so to build and builds everytime the model is refreshed.
I can run the DAX expression in excel, but sometimes run into memory issues, which does not happen building the static table in pbi.
Now to the question: Is there a way of building that DAX table conditionally with a variable, true or false. - true build/false don;t build. Then I can switch the build off for most of the time and build it once a month when needed for XL export.
I tried this but i get the error “Expression refers to multiple columns. Multiple columns cannot be converted to a scalar value”.
So it seems SWITCH and IF only work with scalar values. grrrr!
Checked that out. I’m pretty conversant with variables, but you gave me the idei of creating my table as a variable, but the same error message appears.
To be clear my dax looks something like this:
Var vBuildTable = 1 //If 1 table will build set only for month end xl export
Return
If(vBuildTable = 1,
       SUMMARIZECOLUMNS(
            MAReports[MARepCat],
            MAReports[AccountKey],
            MAReports[MARepLine],
            MAReports[AccountName],
            SiteCodes[Consolidation01],
            OperationCodes[MADeptCategory],
            SiteCodes[Dealership],
            CostCentres[CostCentre],
            MAFormats[Header],
            MAFormats[SubHeader],
            CostCentres, //THIS HAS BEEN ADDED TO SHRINK DOWN DUPLICATIONS
            FILTER(MAFormats,MAFormats[FormatType]="MA"),
            "MAData", CALCULATE([MANumberToXL],USERELATIONSHIP(MAFact[CostCentre],CostCentres[CostCentre]))
        )
But this errors with “Expression refers to multiple columns. Multiple colums cannot be converted to scalar value”
The error message you’re getting is due to the fact that while a variable can be a table, the measure can only return a scalar. When you try to return a table from a measure you’ll get that "“Expression refers to multiple columns…” error message.
I never like to say something is not possible in Power BI, because someone more clever usually comes up with ingenious workaround and proves me wrong, but in this case I’ll put it out there that I think what you’re trying to do is not possible.
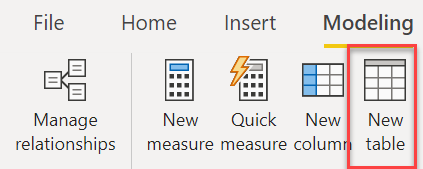
You can create that table on the fly manually via:
But to my knowledge there is no way to call that command conditionally via a measure.
Sussed my workaround here. Sam will probably hate it LOL!
Remember I’m trying to create a DAX table but not on every model build because the table is a bit slow to build.
So workaround is as follows:
var vMyTable = SummarizeColumns(…long list as in my previous post)//big table
Then when I want the table built for export I can just comment out SummarizeColumns(Stream[Stream])
uncomment vmyTable. I’m using streams since it is a column iwth only 3 or 4 values, so quick to build
Thanks to everyone who chipped in here. Sometimes it just jogs you along the thought process.
Oh, OK - now I understand your question a bit better. I thought you were trying to build a physical table conditionally based on a measure. That I still believe is not possible. But as I now understand it, you are just trying to conditionally compute over a long virtual table or a shorter one. THAT is absolutely doable.
If you’re happy with your current comment solution, that’s totally cool. But if you would like a proposed approach that doesn’t require the manual commenting, I’m happy to work up a mockup for you. Just let me know.
I’d be grateful for that Brian. Always willing to learn and I’l be using the same technique for budgeting later in the year which will require slightly different long tables.
This is actually a very cool problem. I think I’ve got a good strategy that will work for this, but before I build it out, a couple of questions:
are you able to share your PBIX file with any confidential data removed? I can mock this up using some of the Enterprise DNA sample data, but might as well make the solution as specific to your particular situation as we can.
what do you want the page/visual to show if the conditions for generating the table are not triggered?
Thanks for helping me out with this, most grateful.
Difficult to share pbix really, data is abit sensitive and I’m not sure how to clear it down easily for you.
The table will not be used for any visual at all. It is solely being generated for excel export purposes.
My visuals will probably never access this table since they are looking at s decent star schema already.
Okay, I think I’ve got a solution that will work for you. Originally, I tried doing this by materializing a physical table via DAX using Modeling-New Table and what-if parameters. However, that proved to be a dead-end since tables created that way are blind to SELECTEDVALUE and ALLSELECTED parameter and slicer harvests.
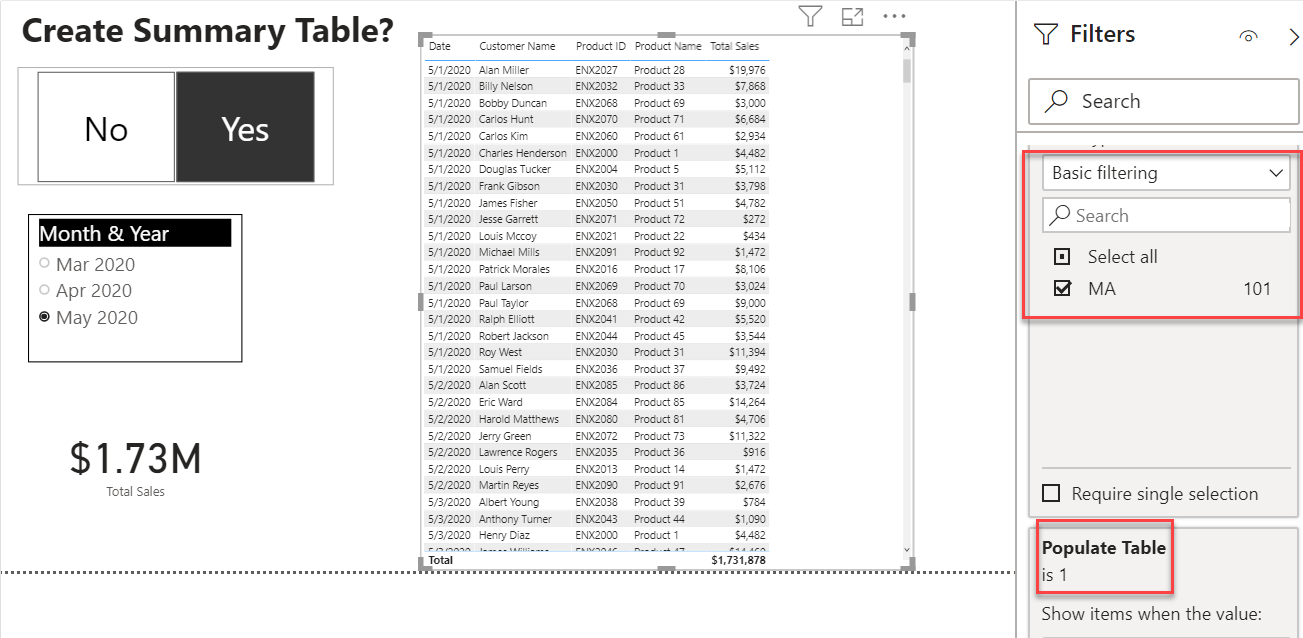
So instead, I took the approach of creating a visual that mimicked your filtered SUMMARIZECOLUMNS statement, including calculating a measure (in this case Total Sales) over an inactive relationship via USERELATIONSHIP.
The measure that does most of the work is:
Populate Table =

VAR LastDayCurrentMonth =
    DAY(
        EOMONTH( TODAY(), 0 )
    )

VAR TablePop =
SWITCH( TRUE(),
    DAY( TODAY() ) = LastDayCurrentMonth , 1,
    //on the last day of the current month, returns the long table
    //regardless of what is selected in the choice slicer
    [Harvest Create Choice] = "Yes", 1,
    0
)

RETURN
TablePop
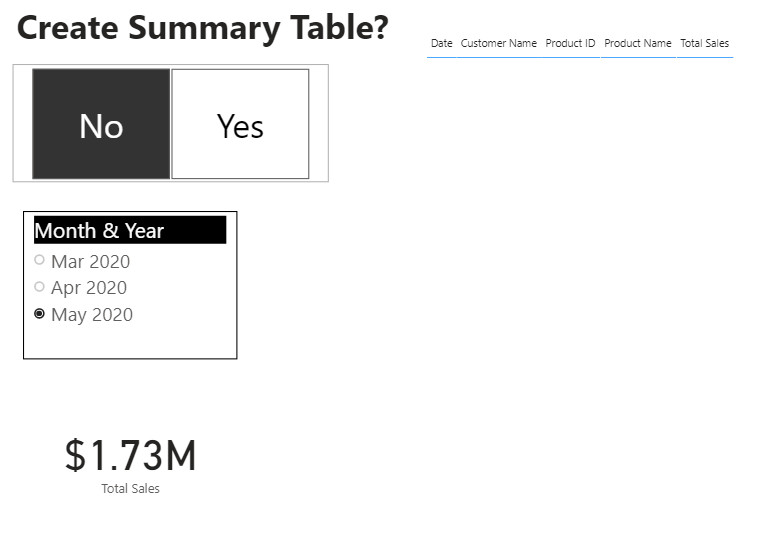
So, here’s what it looks like when the Create Table slicer = No: (note I also added a relative date slicer that gives the option of the current month and either of the two prior months):
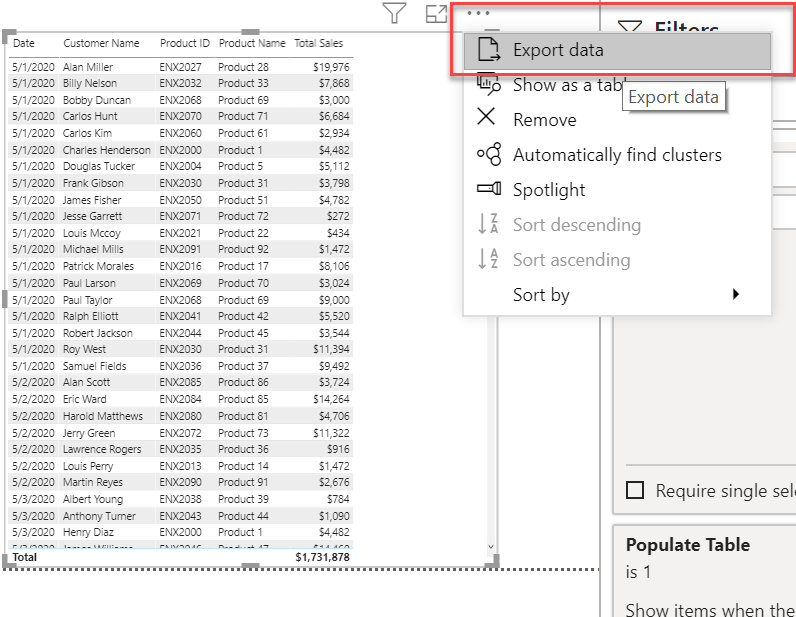
To export the data into Excel, when the table is visible click on the three dots in the top right and select Export Data. This will allow you to blow the entire table out to a .CSV file that you can then import into Excel.
Thanks. Looking back at it, this looks borderline insane to me in terms of the level of effort to avoid deleting two forward slashes in Pete’s original solution. However, by the time I realized what it was going to take, I was already too far dug in to turn back. Plus I learned some interesting things about the limitations of what-if parameters, since I don’t use those very often in my own reports.
Thanks Bryan ever so much. Such a cracking community this.
I’m not sure I understand it on first read and I have day full of my dayjob as FD to folllow.
I’ll get me head around it when I get a momement though.
Looks wicked and possibly useful for other things here.
I agree - this is a phenomenal community. I learn new stuff here every single day.
No worries re: timing. That’s why we post the solution files - to give you the opportunity to dig into the solution at whatever level of detail you need to fully understand it (and to give others the opportunity to improve upon it). Feel free to give a shout if there are any aspects you have questions about after you have a chance to review.
@ankit - thanks for the kind words. @sam.mckay makes doing the videos look easy, which they are definitely not. But we’re starting to get the hang of it, and have what we think is some interesting and useful content planned over the next weeks and months, almost all generated by problems and questions we’ve come across in the forum.
Hi @Pete673, a response on this post has been tagged as “Solution”. If you have a follow question or concern related to this topic, please remove the Solution tag first by clicking the three dots beside Reply and then untick the check box. Thanks!