Counting rows / summing volumes depending on multiple Filter items

Hi there,

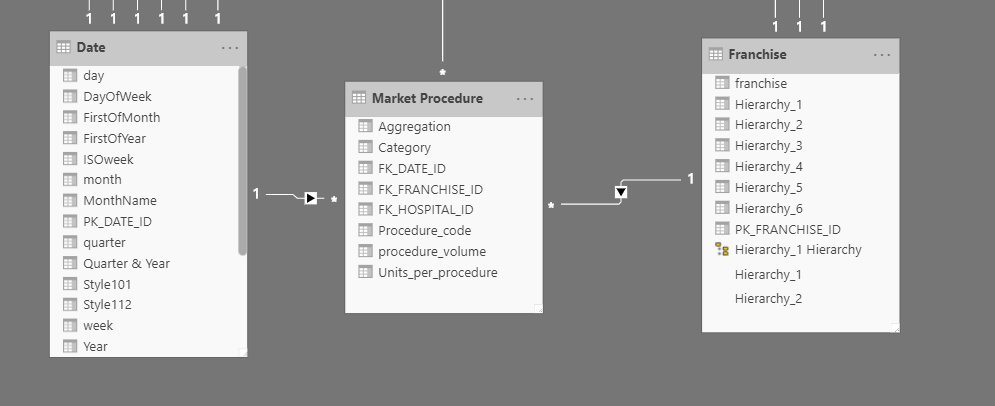
This is the guy again that was showing you the worst data model ever!! I have created a dimensional model on top of that model and that works just fine. :slight_smile:

I have a question for you that has to do with calculating values depending on the filter selection:
Example:

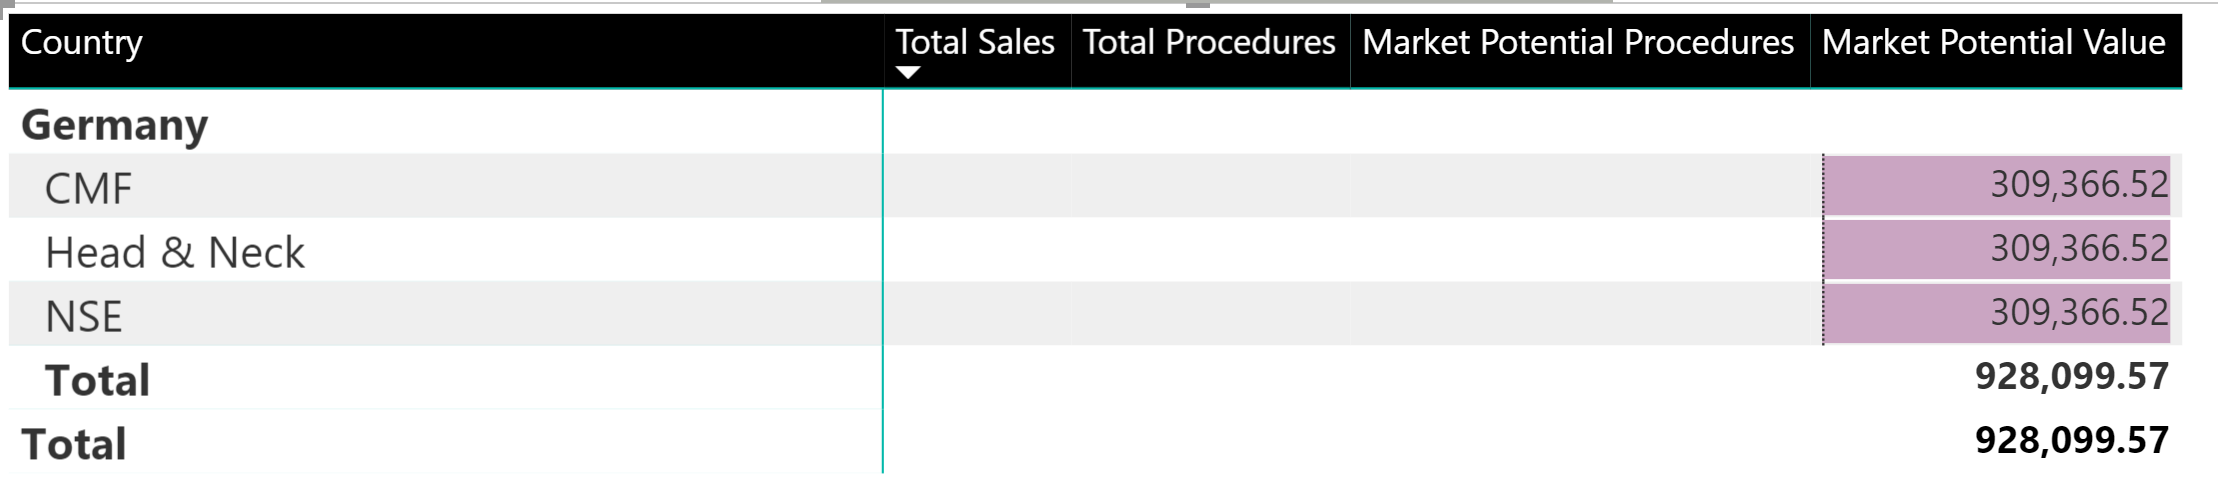
There is a hierarchy with names : CMF , NSE
There are volumes belonging to CMF and NSE and volumes belong to them both.

The names is used as a filter where NSE, CMF or both can be selected.

When NSE is selected the volumes should be calculated for NSE and for both of them.
When CMF is selected the volumes should be calculated for CMF and for both of them.

The volumes are being used to calculate potential values. I wanna avoid double counting when both CMF and NSE are selected.

I was thinking of a solution but maybe you can point me in some direction of how to handle this challenge?

kind regards,
Sjaak

Really will have to see an example to give a good answer here.

Finding it difficult to dream up a solution with just this info and not seeing everything else that could be a play.

Thanks
Sam

Ok,

Going to explain in real detail what I want…

In the dataset I am using we are talking about a hierarchy called franchise Head & Neck where in level 1 two hierarchy items are brought together. CMF an NSE.

Now the business want to have the CMF and NSE as a franchise. In the CMF and NSE are volumes of procedures which are being used to calculate market potential.

The thing is there are overlapping procedures both being used by CMF and NSE.

When the user wanna see the potential for Both CMF and NSE the overlapping should only count once.
In the first screenshot its clear for Head & Neck.

When divided Head & Neck in CMF and NSE the counting will be doubled.

I don’t want that I only want counting once.

Was thinking of introducing an extra column in the table mentioning CMF, NSE or Both NSE and CMF
and depending on the filter using the calculated market potential.

WHEN CMF or NSE is selected use Numbers for CMF or NSE summed with the overlapping procedures for both of them.

I hope this is a better way of explaining what I want …

kind regards,
Sjaak

Still struggling to understand this. There is just to much at play here to give a solid answer.

There’s the overall scenario, data model, relationships, the data, context, DAX formulas, filters, hierarchies…

Need to see a demo example file with all this laid out to offer real assistance here.

This answer could be very simple, but it’s difficult to say at the moment.

Thanks
Sam

Hi

Another attempt to explain what I am trying to accomplish…

Some relevant model:

Procedure_Volume belongs to franchise for a given period
Untill Know procedures belonging to CMF and NSE where placed under Head & Neck. If a procedure belongs to both of them is eliminated.

Now there is a demand to have Both NSE and CMF as a franchise themselves.

Now it is possible a procedure with its volume belongs to both NSE and CMF

In order to count the number of procedures correctly
the following:
I introduced a category like follows:
1 CMF
2 NSE
3 Both

When counting is needed for CMF it’s category 1 + 3
When counting is needed for NSE it’s category 2 + 3
When both are needed it’s category 1 + 2

Now I am trying to create a measure that calculates based on the filter selection for the franchise:

Selected Values Franchise = IF
(
                              CONCATENATEX(
    				 ALLSELECTED(Franchise[franchise]),
    				 Franchise[franchise],
    				 ", "
)="CMF",
calculate(
sum('Market Procedure'[procedure_volume]),
FILTER(
'Market Procedure','Market Procedure'[Category]=2 || 
'Market Procedure'[Category]=3)),
                             IF
(
 CONCATENATEX(
    			        ALLSELECTED(Franchise[franchise]),
    				 Franchise[franchise],
    				 ", "
)="NSE",
calculate(
sum('Market Procedure'[procedure_volume]),
FILTER(
'Market Procedure','Market Procedure'[Category]=1 || 
'Market Procedure'[Category]=3)),
IF
(
CONCATENATEX(
    				ALLSELECTED(Franchise[franchise]),
    				Franchise[franchise],
    				", "
)="CMF, NSE" 
|| CONCATENATEX(
    				ALLSELECTED(Franchise[franchise]),
    				Franchise[franchise],
    				", "
)="NSE, CMF",
Calculate
(
sum('Market Procedure'[procedure_volume]),
FILTER(
'Market Procedure','Market Procedure'[Category]=1 || 
'Market Procedure'[Category]=2)),"0")))

hopefully this give you now a more clear overview

kind regards,
Sjaak

Sorry no better. Really still have no idea how to assist here. I just don’t understand the scenario without having a look at any data, relationships etc. I’ve read through the post many times and sometimes it’s just too difficult to understand everything at play here as mentioned earlier.

Can you break done the issue to it’s simplest form and send through a demo file (with demo data)? This is how to too the quickest help here.

One recommendation here as well (as this is a long formula), break it out into pieces. And bit by bit. This is the ‘measure branching’ technique I talk a lot about. Then you can place all the results into tables and see how they act when the context is changed. Highly recommend this. I’m very adverse to long formulas unless absolutely necessary.

Thanks
Sam

Hi,

I have managed to work it out. I show you what I have done…

When I Both select CMF and NSE from Franchise filter:
image

Now when I select only CMF

Formula used:

    Selected Values Franchise potential =

    IF

    (

    SEARCH("CMF",[Franchise Filter NSE CMF],1,0)>0

    &&

    SEARCH("NSE",[Franchise Filter NSE CMF],1,0)>1,

    CALCULATE(sum('Sale Potential'[Estimated_Potential_Value_EUR]),

    Filter

    (

    'Sale Potential','Sale Potential'[Category]=1

    ||

    'Sale Potential'[Category]=2

    ||

    'Sale Potential'[Category]=0))

    +

    [Potential_Category 3],

    CALCULATE(sum('Sale Potential'[Estimated_Potential_Value_EUR]),

    Filter

    (

    'Sale Potential','Sale Potential'[Category]=1

    ||

    'Sale Potential'[Category]=2

    ||

    'Sale Potential'[Category]=0

    ||

    'Sale Potential'[Category]=3

    )

    )

    )

Ok great thanks for sharing the solution.

Even with the answer I still don’t really get the scenario.

It’s difficult with Power BI, there can be some much going on that just looking at an individual piece is usually never enough.

The main reason I need to see all factors at play is because the best solution could be so varied. It could be just a formula, but could be solved in the query editor or data model also.

So that why I was asking for more info on this one.

Thanks
Sam