I am curious as to how one would go about counting a measure with multiple if statements. For example, my code is as follows for the measure:
STATUS = SWITCH( TRUE() ,
[ACTUAL USA] <1 , "OUT OF STOCK:URGENT PRODUCTION",
[ACTUAL USA] <6, "REVIEW CUSTOMER ORDERS:URGENT PRODUCTION",
AND ([TOTAL WEEKS OF INVENTORY] <18, [ACTUAL USA]<12), "RISK:URGENT PRODUCTION",
AND([TOTAL WEEKS OF INVENTORY] <18, [ACTUAL USA]>12)"PRODUCTION",
AND ([TOTAL WEEKS OF INVENTORY]>18, [ACTUAL USA]>18)"IN STOCK",
"REVIEW CUSTOMER ORDERS:URGENT PRODUCTION")
I then drag this measure onto a matrix table where it can dynamically change but assigns a category or [status] to item SKUs.
I want to get a count of how many of each individual result there are. The table I use has customer and item SKU as the identifiers. The results of the STATUS measure are dynamic as they will change depending on how [ACTUAL USA] and [TOTAL WEEKS OF INVENTORY] are filtered.
Is this possible? Basically I want to create a small table that has the calculated segments as categories and then count how many of each segment there are.
If you can point me in the right direction it would be greatly appreciated !
The data itself is not shareable but if I need to clarify or create a sample set please let me know.
You could create a supporting table with all possible text results (exact match) and an optional Index column if you ever wanted to sort the results in a specific order…
Once you have that in place you can use it to slice by and iterate over.
Here are a few related courses, you can use the search option for additional material
Hello! I believe that the closest thing I can find to a solution is creating a support table with the category and limits. I believe this is a good direction. I watched the video explaining this method but I can’t seem to wrap my head around how to do it with multiple mins and maxes.
My segments are based on multiple conditions. So thinking this through I would have limits for each measure in the if statements.
So I would have the following columns :
USAMIN USAMAX TOTALMIN TOTALMAX CATEGORY
Now I believe this is the right direction. The issue is creating the measure to put it all together. How would one include multiple mins and maxes into the formula? I posted the sample formula from the file you have provided.
          Outstanding per Group =
FILTER( VALUES( Invoices[Aging Days] ), // replace "Invoices[Aging Days]" with the column to be grouped
        COUNTROWS(
            FILTER( 'Aging Groups', // replace "'Aging Groups'" with the supporting table name
                AND(
                    Invoices[Aging Days] >= 'Aging Groups'[Min],
                    Invoices[Aging Days] <= 'Aging Groups'[Max]
                )
            )
        ) > 0
)
Hi @dataray. Can you please prepare a small sample PBIX with sample data and a mockup of your desired outcome to help visualize the solution? Thanks,
Greg
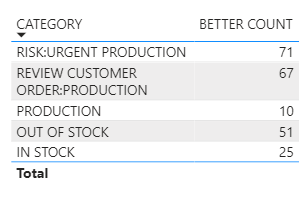
The visual I would like is the second visual with Category and FalseCount fields. The number is inaccurate because it isn’t taking into account the real conditions. This is what I am trying to figure out.
Got your sample PBIX … thanks … yes, I see the issue. The dynamic grouping pattern and supporting table technique, after a few tries, doesn’t appear to handle the case of a separate visual without the original context. I’ll keep thinking on it and will post anything that turns up.
Hopefully other forum members have handled this before and have comments.
Hi @dataray we’ve noticed that no response has been received from you since the 17th of October. We just want to check if you still need further help with this post? In case there won’t be any activity on it in the next few days, we’ll be tagging this post as Solved. If you have a follow question or concern related to this topic, please remove the Solution tag first by clicking the three dots beside Reply and then untick the checkbox. Thanks!
Hi @dataray, a response on this post has been tagged as “Solution”. If you have a follow question or concern related to this topic, please remove the Solution tag first by clicking the three dots beside Reply and then untick the check box. Thanks!
I went a slightly different route - creating a new SWITCH measure to return the count:
BETTER COUNT =
VAR OutOfStock = COUNTROWS( FILTER(inventory , [INVENTORY IN USA] <1 ))
VAR ReviewProduction = COUNTROWS( FILTER( inventory, [INVENTORY IN USA] <6))
VAR RiskUrgent = COUNTROWS( FILTER( inventory, AND( [INVENTORY IN USA] <12, [Weeks of Inventory] <18)))
VAR Production = COUNTROWS( FILTER( inventory, AND( [INVENTORY IN USA] >12, [Weeks of Inventory] <18)))
VAR InStock = COUNTROWS( FILTER( inventory, AND( [INVENTORY IN USA]>12, [Weeks of Inventory] >=18)))
Thanks to the contributors of this post. Due to the length by which this post has been active, we are tagging it as Solved. For further visibility, please start a new topic within the forum… You may check this how-to guide for reference - How To Use The Enterprise DNA Support Forum
I appreciate your response but i don’t believe it is giving me the results I am looking for. I am seeking to count the amount of each category in the visual not in the overall table.
I ended up switching the result of the measure from a text value into a numeric value. From there I created a similar structure to the bucketing formula except I listed the category with the corresponding value of the measure inside of the table.
So my bucket table had just the category with the number value I assigned it in the switch formula. From there I just used the number value as the limit.
Thanks to all of you who have helped ! I’ll see you around the forums
If anyone comes across this issue in the future, I used the resource videos @Melissa provided in the thread to set up the bucketing method.