Counting distinct people of MMMYY

Hi there,

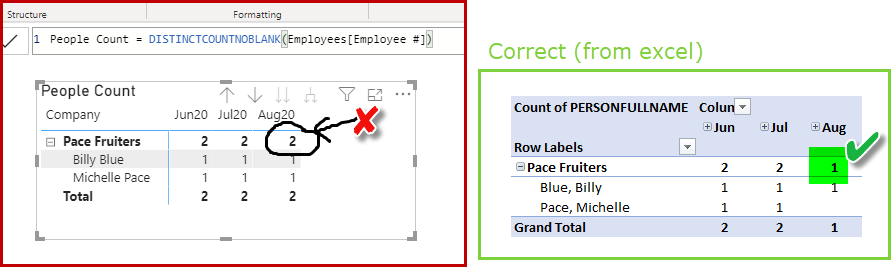
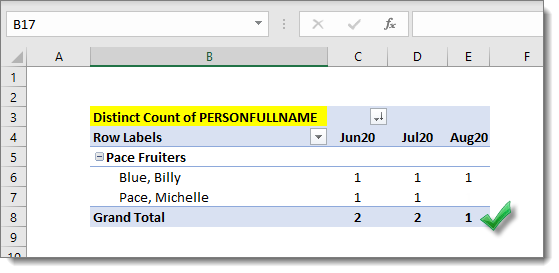
I’m still working through Sam’s “beginner dax course.” But as of yet, I have not been able to figure this out (at all). Excel gives me the correct answer as shown below. But not Power Bi. Could someone please help correct my People Count dax formula so that it gives the correct answer?

Q.08 Varying count of people over time.pbix (114.1 KB)
Q.08 Data.xlsx (520.4 KB)

Thank you in advance,
Michelle

Hi @michellepace,

There is no Date dimension in Employees only in the EmployeeHours table.

Give this a go:

Emp Count = 
DISTINCTCOUNTNOBLANK( EmployeeHours[Index] ) 

I hope this is helpful

1 Like

Hello @michellepace,

Thank You for posting your query onto the Forum.

Below is the screenshot provided for the reference of the result that you’re trying to achieve.

Counting Distinct People of MMYY

Thanks and Warm Regards,
Harsh

1 Like

Well I guess me and @Melissa both started working on the same solution at the same time. :smile:

Hello @Melissa and @Harsh,

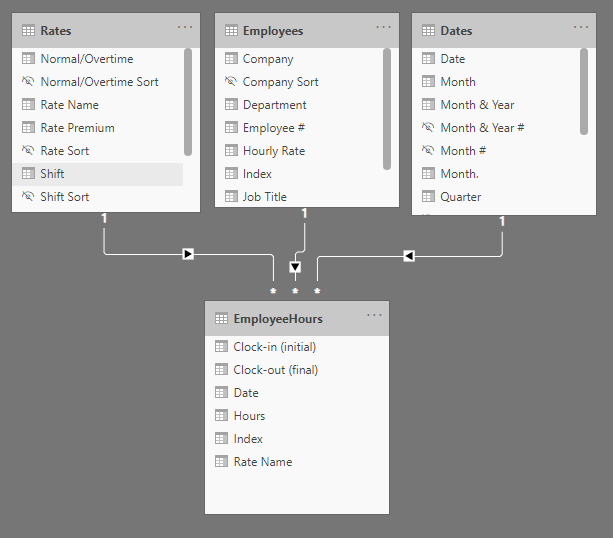
Thank you both for your replies. However neither are correct as they both imply that an employee only works one day in a month. As soon as I make “Michelle” work 3 days in July, the numbers become incorrect. But again with excel… it’s perfectly correct. I’m open to “re-shaping” my employee / employeehours table into a better design if this is what is needed.

Revised sample data attached and revised .pbix
Q.08 Data.xlsx (520.1 KB)
Q.08 Varying count of people over time.pbix (115.3 KB)

Any ideas?

Hello @michellepace,

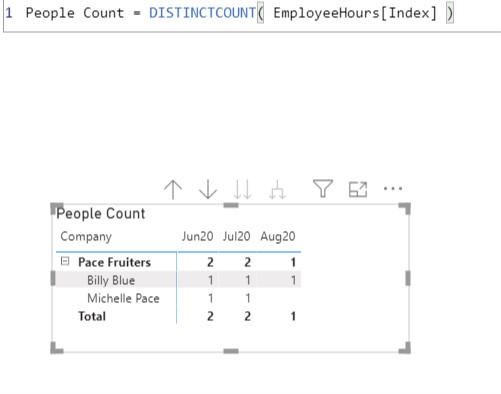
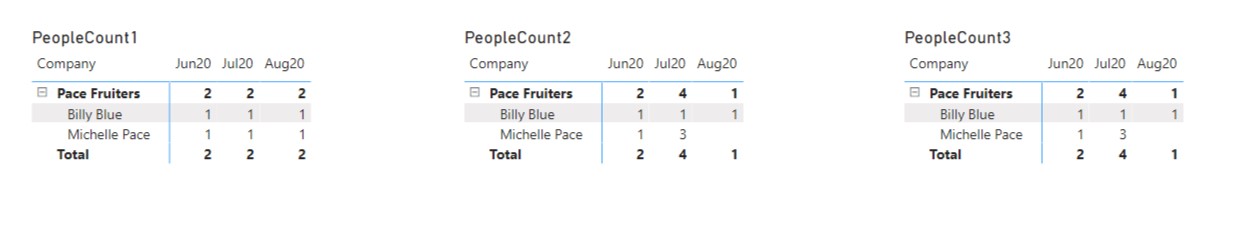
I’m bit confused because @Melissa’s formula and my formula shows the identical result as shown in the Excel file. Below are the screenshots provided for the reference -

Counting Distinct People of MMYY - 2

Can you please help us where are we missing?

Thanks and Warm Regards,
Harsh

Q.08 Varying count of people over time.pbix (115.1 KB)

Hi @michellepace,

Give this a go

PeopleCount3 = 
CALCULATE(
    DISTINCTCOUNTNOBLANK(Employees[Person]),
    EmployeeHours 
)

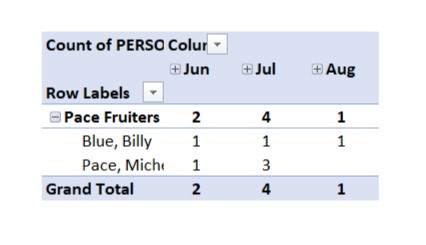
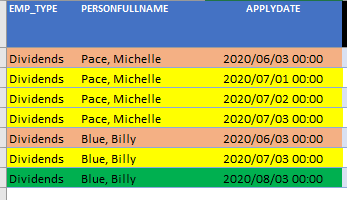
Sorry… let me ask it another way. I need a power bi table which answers the question: “How many employees worked for us during each month?” One row of data is one day worked by an employee, they can work multiple days in a month. I got my excel pivot wrong myself, but now it is right for sure. I need to replicate this in power bi.

Please see: Q.08 Data.xlsx (1.1 MB)

t

s

Okay so without the subtotal for Company it would look something like:

PeopleCount3 = 
IF( ISINSCOPE( Employees[Company] ) && NOT( ISINSCOPE( Employees[Person] )), BLANK(),
    CALCULATE(
        DISTINCTCOUNTNOBLANK(Employees[Person]),
        EmployeeHours 
    )
)

Hi there. Again, thank you for the prompt and comprehensive replies. This forum is really great. I also got an alternative answer which is easier for to understand and so far completely error proof on a 40,000 row data set. I’ll post it here just in case it is of use to anyone else:

PeopleCount1 = CALCULATE (
   DISTINCTCOUNTNOBLANK ( Employees[Employee #] ),
   CROSSFILTER ( EmployeeHours[Index], Employees[Index], BOTH ))