Counting Blank rows for multiple columns

Hi there,

I’m busy investigating my data and what would be really useful is to know how many blank rows a column has, verse non-blank. For example, in a table made up of 3 columns which has 100 rows… I’d like to create a matrix like this:

Question: If this is possible, could someone please help me with the generic Dax for these two blue measures? (COUNTBLANK(< column >) ) won’t work for me as it is particular to one column only)

image

As always, thank you.

@michellepace,

Two quick questions:

  1. Can you please provide a sample dataset for us to test on?
  2. Does it have to be DAX, or would a Power Query solution also be acceptable?

Thanks.

  • Brian

Hi Brian,

thank you for your reply. The reason I am asking for dax is that I would like to write the two measures ONCE each. And then depending on the columns I drag into them, they generate the answers. I hope that makes sense. Sample data set attached.

In other words, I have a lot of tables and a lot of rows to check. My data is so big that even to do a column profile takes forever. Book1.xlsx (9.6 KB)

REgards
Michelle

@michellepace,

Thanks. DAX it is then… :grinning:

  • Brian

@michellepace
To get the result I unpivoted the data by creating a calculated column with DAX:

Unpivot =
UNION (
SELECTCOLUMNS ( Data, “Category”, “MyColumn1”, “Value”, Data[MyColumn1] ),
SELECTCOLUMNS ( Data, “Category”, “MyColumn2”, “Value”, Data[MyColumn2] ),
SELECTCOLUMNS ( Data, “Category”, “MyColumn3”, “Value”, Data[MyColumn3] ))

Created Two Measures one to Count Blank and other to Count Non-Blank

Blanks =
COUNTBLANK(Unpivot[Value])

Non-Blank =
COUNTA(Unpivot[Value])

Then dragged and dropped the into the relevant fields in Matrix Table

Attaching the PBIX file and Excel file for your review.

Count Blank Rows.pbix (34.8 KB) Book1.xlsx (9.6 KB)

@michellepace,

I took a much crazier approach then @MudassirAli, attempting for some reason to avoid creating the physical unpivoted table, doing it all through virtual table functions. Same end result, but what took him 9 lines over two measures, took me 80 lines.

Here’s the first measure. Second one is identical, but just <> BLANK() in the relevant filter condition.
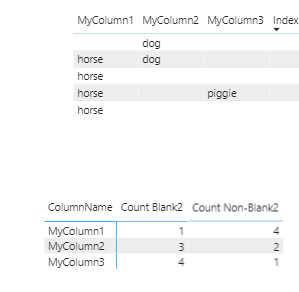
Count Blank2 = 

VAR vTable = 'Table'
VAR Unpivoted =
UNION(
        SELECTCOLUMNS(
            vTable,
            "@ColumnName", "MyColumn1", "@Column1", [MyColumn1]
        ),
        SELECTCOLUMNS(
            vTable,
            "@ColumnName", "MyColumn2", "@Column1", [MyColumn2]
        ),
        SELECTCOLUMNS(
            vTable,
            "@ColumnName", "MyColumn3", "@Column1", [MyColumn3]
        )
    ) 
VAR CountVals = CALCULATE(
        COUNTROWS(
            FILTER(
                Unpivoted,
                [@Column1] = BLANK() &&
                [@ColumnName] = MAX( 'Col Names'[ColumnName] )
            )
        )
    ) 
VAR vFinalTable = ADDCOLUMNS(
        SUMMARIZE( Unpivoted, [@ColumnName] ),
        "@CountVals", CountVals
    ) 
VAR Prelim = CALCULATE(
        MAXX( vFinalTable, [@CountVals] ),
        FILTER(
            vFinalTable,
            [@ColumnName] = SELECTEDVALUE( 'Col Names'[ColumnName] )
        )
    ) 

RETURN
Prelim

image

I hope this is helpful. Full solution file attached below.

2 Likes

Hi @michellepace, did the response provided by the experts help you solve your query? If not, how far did you get and what kind of help you need further? If yes, kindly mark the thread as solved. Thanks!

Hi @michellepace, a response on this post has been tagged as “Solution”. If you have a follow question or concern related to this topic, please remove the Solution tag first by clicking the three dots beside Reply and then untick the check box. Also, we’ve recently launched the Enterprise DNA Forum User Experience Survey, please feel free to answer it and give your insights on how we can further improve the Support forum. Thanks!

Hi Brian and Mudassir,

Thank you both for your replies. They do give me an answer but… my problem is I have 16 tables with an average of 18 rows each. So what I need (although I am beginning to think it is not possible) is a measure called BlankRowsCountInAColumn and NonBlankRowsCountInAColumn. And then simply drag all my different columns (16x18) into a matrix along with those two measures. Essentially I am trying to visualse a subsection of when you do a column profile in Power Query.

The reason I am doing this is I want to be able to communicate my findings on a report page. Rather than doing a copy past of all the column profiles into excel.

But, I am sure as neither of you have arrived at a generic answer like this… I’m not so sure if what I am asking for is possible?

@michellepace
We can’t be able to tell whether it’s possible or not unless we can have a look at the PBIX file. The more complex the requirement, the larger the need to have the dataset to work with. If possible, please share your files so we can try to provide the solution.

I think with those many table, most of the task would still depend on PQ for transforming data so that DAX can iterate on it.

I just want DAX to have the ability to iterate column by column and one function that fetches column names. :sob:

@michellepace,

I agree with @MudassirAli that to get to the solution you are requesting, we need to see something that more closely approximates your actual data scenario. Given what you described, I’m still not understanding why a Power Query solution wouldn’t be best here – create a nested table structure comprised of all 16 tables, where we we can iterate over each table, calculating the blank and nonblank counts for each – the results of which can be placed directly into a single visual.

As @AntrikshSharma says, some elements of the requested solution are difficult to impossible in DAX such as fetching column names, while trivial in Power Query (just use Table.ColumnNames() )

  • Brian

Hi @michellepace, a response on this post has been tagged as “Solution”. If you have a follow question or concern related to this topic, please remove the Solution tag first by clicking the three dots beside Reply and then untick the check box. Also, we’ve recently launched the Enterprise DNA Forum User Experience Survey, please feel free to answer it and give your insights on how we can further improve the Support forum. Thanks!