Hi there,
I have got a data of faliure euipment. I want to create a measure that returns the count of failure happens more than three times on the same location (i.e. Location code) and due to same cause in last 12 months. Here is how I wrote the measure:
Rolling_count =
Var _cause = MAX( ‘Table’[Cause] )
Var _loc = MAX( ‘Table’[LocID] )
var _count = CALCULATE(DISTINCTCOUNT(‘Table’[EventID]),FILTER(‘Table’,‘Table’[LocID] ==_loc && ‘Table’[Cause] == _cause), DATESINPERIOD(‘Date’[Date],MAX(‘Table’[Actual Event Start Time ]),-12,MONTH))
Return
IF(_count>3,_count)
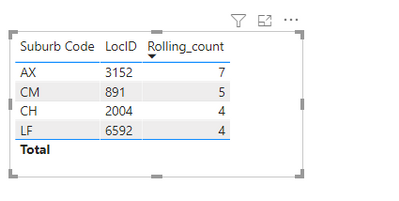
I displayed the measure in table visual as shown below:

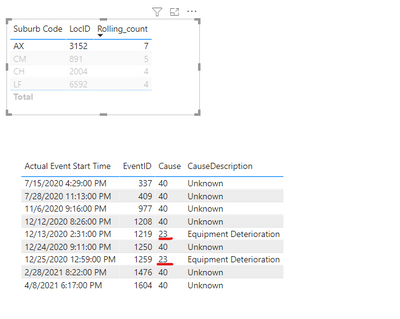
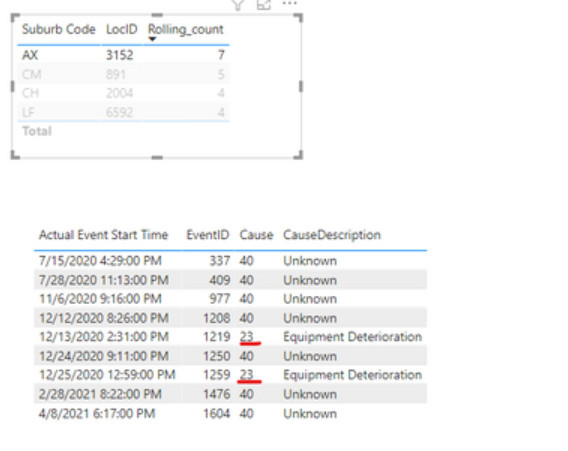
I created another table visual to show the details of that event. For example, if I click the first row as shown in the picture

The problem in the above visual is that Cause number 23 only appears twice, it did not occur more than three times. So it should not be displayed in the list. Could anyone help me in fixing the issue?
