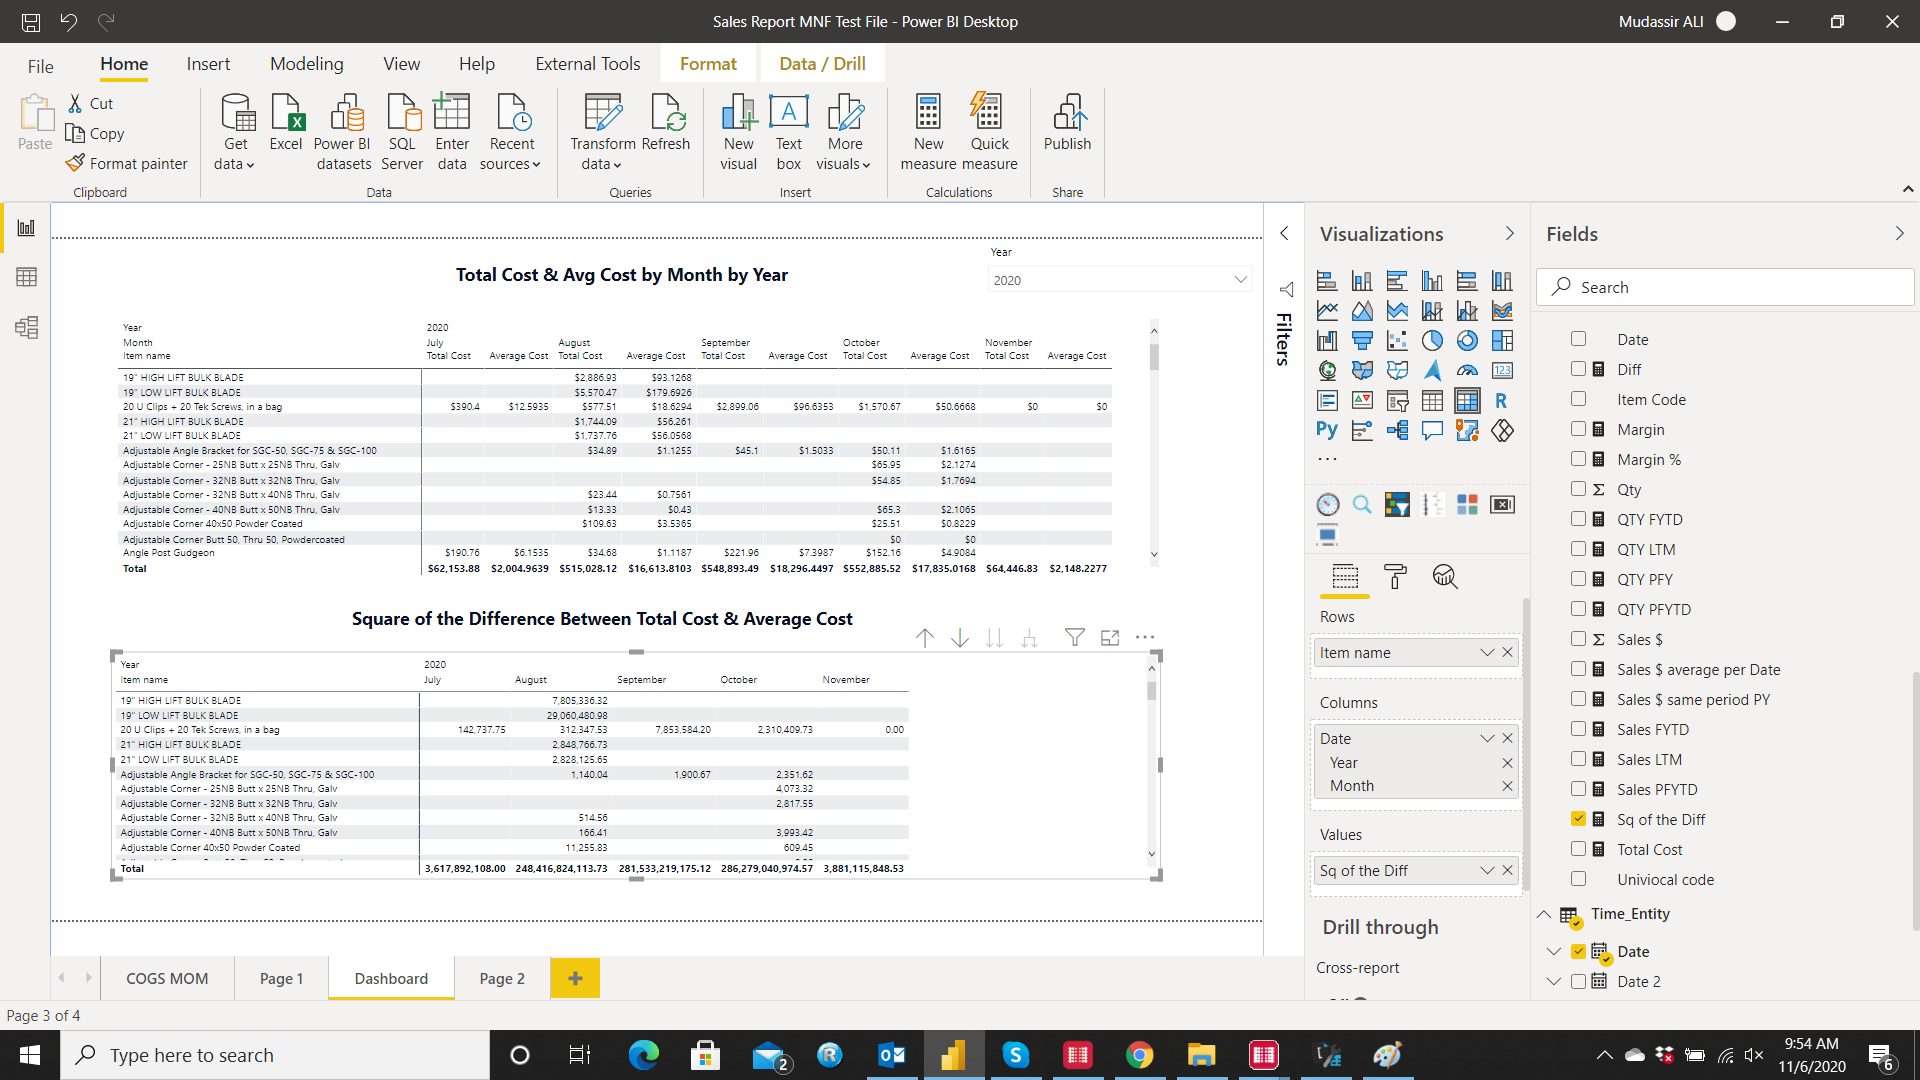
I am trying to calculate a cost variance analysis tab in one of my reports. I want to calculate the average of the cost of goods by month and then taking each month in turn and calculating the square of the difference between the cost for the month and the average cost for that product for FY’20.
Could anyone guide me on which measures should I create to get this result. Attached sample excel to show the results I need.
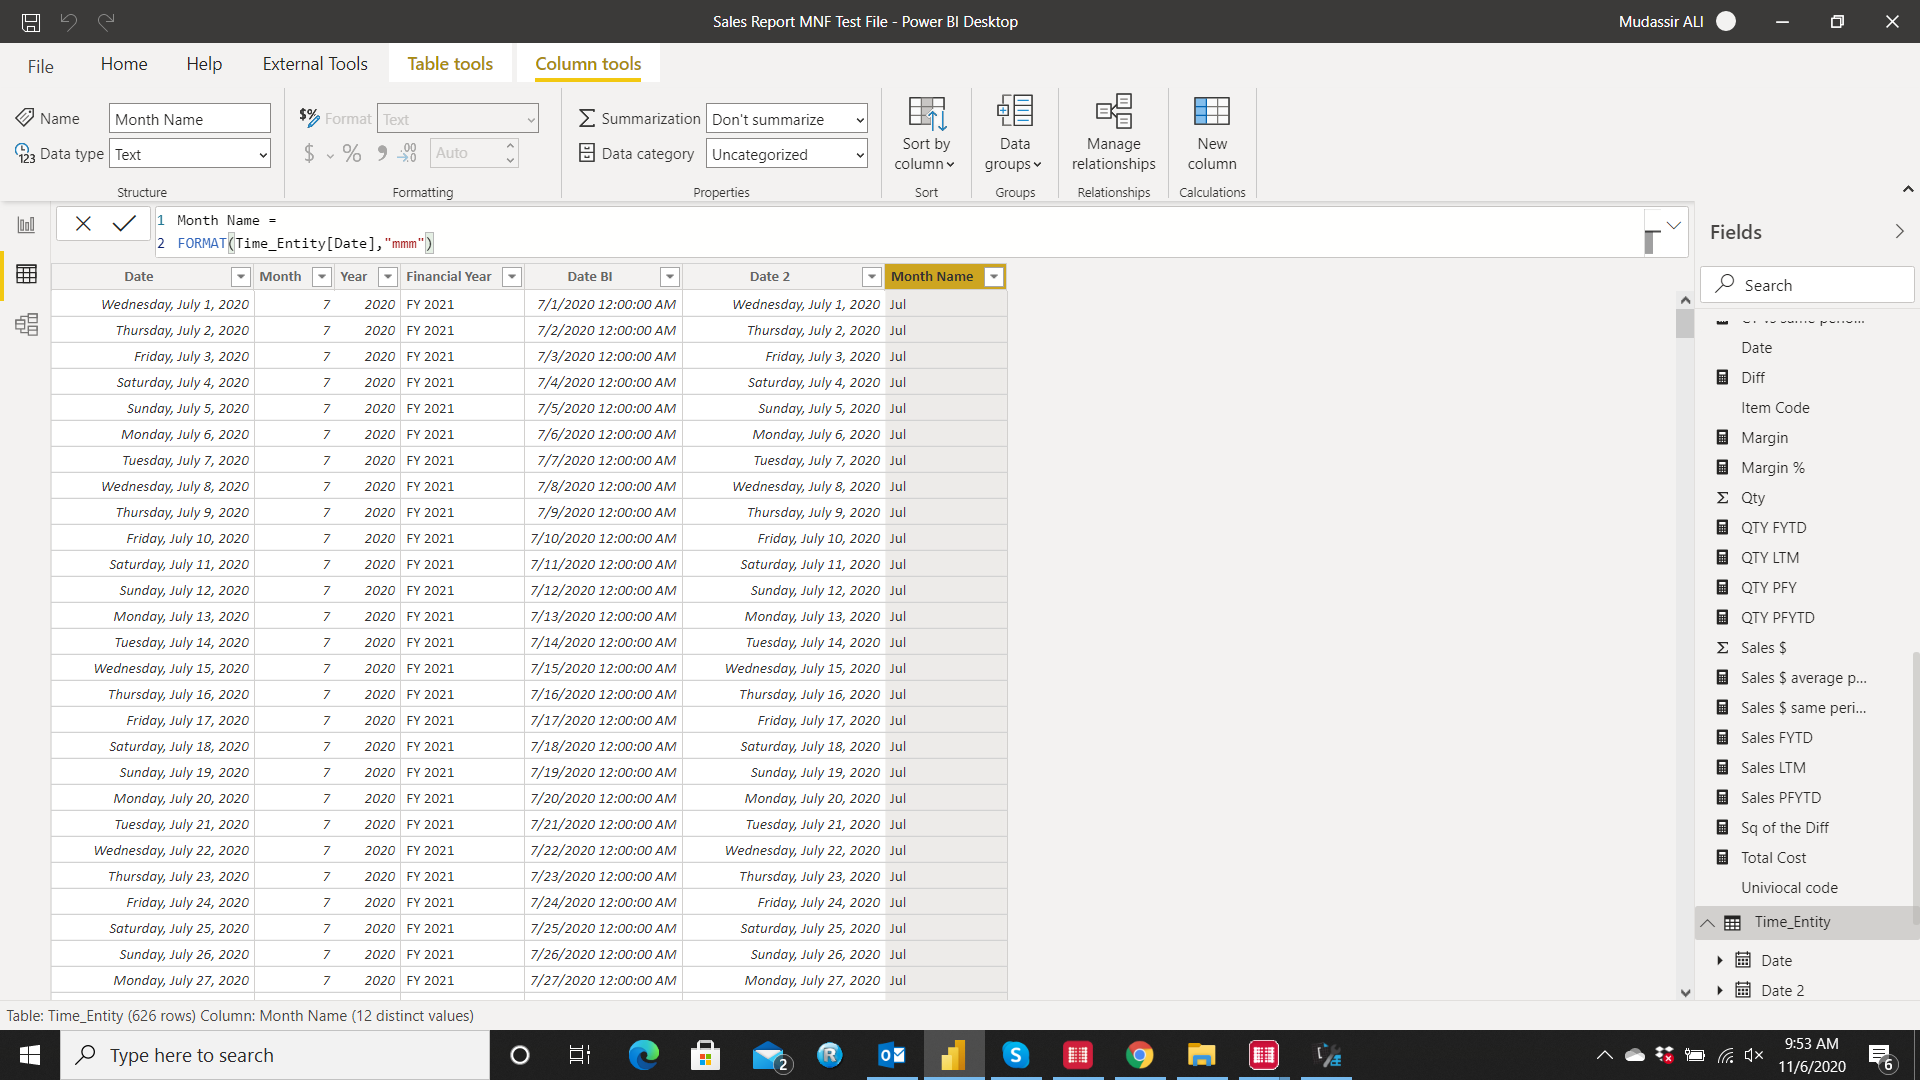
I have the Actual Cost and Total Cost = SUM(Actual Cost) measures created in my dashboard.
Thanks,
NupurCopy of Book3.xlsx (9.3 KB)
Hi @Nupur, we aim to consistently improve the topics being posted on the forum to help you in getting a strong solution faster. While waiting for a response, here are some tips so you can get the most out of the forum and other Enterprise DNA resources.
Use the forum search to discover if your query has been asked before by another member.
When posting a topic with formula make sure that it is correctly formatted to preformated text .
Use the proper category that best describes your topic
Provide as much context to a question as possible.
Include demo pbix file, images of the entire scenario you are dealing with, screenshot of the data model, details of how you want to visualize a result, and any other supporting links and details.
@Nupur
It would be helpful if you could also share your actual or sample source excel file. We don’t know how your data is organized. I believe the file you have attached is the template of Dashboard.
Apologies. I have attached sample file.
The excel which I attached in my previous post is what I would like to see in the visual in the Power BI Report.
Hi @Nupur, did the response provided by the contributors help you solve your query? If not, how far did you get, and what kind of help you need further? If yes, kindly mark the thread as solved. Thanks!
Hi @Nupur, a response on this post has been tagged as “Solution”. If you have a follow question or concern related to this topic, please remove the Solution tag first by clicking the three dots beside Reply and then untick the check box. Also, we’ve recently launched the Enterprise DNA Forum User Experience Survey, please feel free to answer it and give your insights on how we can further improve the Support forum. Thanks!