Conditional format negative percentages

HI, I am trying to conditionally format negative percentage in power bi. Does anyone know if this is possible? I am trying to format a MoM % decrease. So it the values is from 0% to -35% it is Yellow, if it is -35% to -50% it is orange, if it is < -50% it is red.
I am unable to get negative numbers to work. Any ideas?
Suzanne

1 Like

Yes, there’s a couple of ways to do this. Can you please upload a pbix with some sample data so we can best show you how to do this and let us know which visual you want to do this for?

@suzanne

First you can create the measure to assign values as follows:

When < -50% the value is 1,
When <= -35%, the value is 2,
When <=0%, the value is 3.

CF =
IF ( [MOM %] < -0.50, 1,
IF ( [MOM %] <= -0.35, 2,
IF ( [MOM %] <= 0, 3 ) ) )

Select the column where you want the conditional formatting. Here I have applied it on the MOM%. Then turn on the toggle of Font Colors or Background Color whatever you want to conditionally format and then click on Advanced Controls

At final stage, Select the Rules as we have assigned the rules for every range (1, 2 & 3). In Based On Field Selection, select the measure in which we assigned the rules and then assign the colors as you like.

The final result is this

It would be really helpful if you can share your working PBIX file and source file next time when you ask questions on the forum.

Sharing the PBIX file.Conditional Formatting.pbix (24.3 KB)

I hope it helps.
Thanks

4 Likes

I mocked up an almost identical pbix before asking for the pbix myself haha Conditional Formatting Negatives.pbix (15.7 KB)

2 Likes

@suzanne,

@MudassirAli beat me to it. I’ve got a variation on his approach that simplifies the conditional formatting screens a bit:
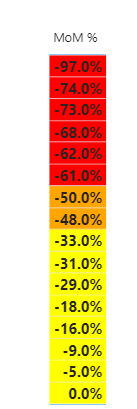
Cond Format Mom% = 

SWITCH( TRUE(),
    SELECTEDVALUE( 'Table'[MoM %] ) < -0.50, "Red",
    SELECTEDVALUE( 'Table'[MoM %] ) < -0.35, "Orange",
    SELECTEDVALUE( 'Table'[MoM %] ) <= 0, "Yellow",
    "Black"
)

Now instead of Conditional Format by Rules, use By Field and set the field equal to your measure:
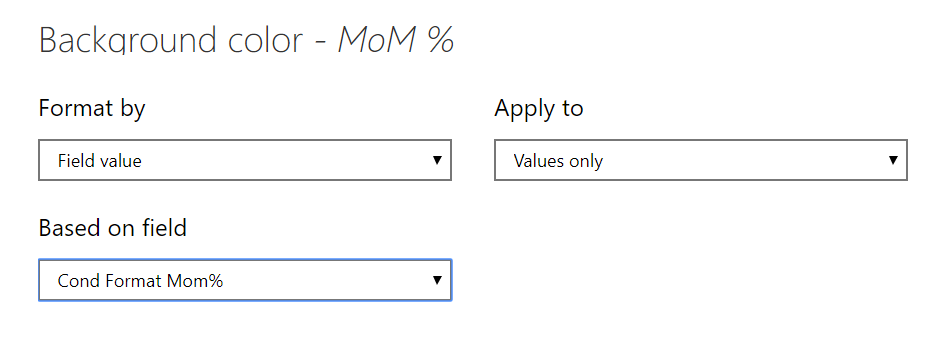
and Voila!

image

One other nice thing about this is that if you want custom hues to match your color theme, you can use hex codes in the measure instead of color names.

I hope this is helpful. Solution file attached.

8 Likes

@BrianJ Awesome.
Now we have 3 variations already for conditional formatting.

1 Like

Three different and totally valid approaches all within a few minutes of each other. I love this place… :grinning:

2 Likes

Just for reference, here are the color names that Power BI recognizes:


Source: https://blog.crossjoin.co.uk/2018/08/10/colour-names-supported-in-power-bi-conditional-formatting/

  • Brian
3 Likes

Thank you, all of you. Th
is is what I needed.

@BrianJ
You are 100% right. When you complete the challenges, you get better in implementation but reading or solving the posts on the forum really do wonders for the concepts.

3 Likes

@MudassirAli,

Spot on. This is a perfect example – I used to do 95% of my conditional formatting by rules, until I saw @JarrettM use the field value/hex code approach in a couple of forum posts and then realized how powerful it was – works for icons, font colors, backgrounds, etc. Now do the vast majority of my conditional formatting this way.

Without seeing it in the forum, I never would’ve explored it since the rule-based approach works fine.

  • Brian
2 Likes

@MudassirAli, the technique described by @BrianJ can be taken a further step if needed.

I have a report that was created to make reports for different customers, and the color of the conditional formatting (used in more than one table in the report) needed to change to compliment the customer’s branding.

So, I created a measure that is called ConditionalColor - and I call that in the Conditional Format measure, so (for instance) instead of “Red” in the example above, the color for < -0.50 would be [ConditionalColor].

With this trick, I just change the color in the ConditionalColor measure and it adjusts all the necessary tables when creating a different version with a new color scheme.

4 Likes

@Heather,

Great enhancement. I’m working on a video on using DAX to carry the load on conditional formatting, and I’m definitely including this tip (with proper attribution, of course… :grinning:)

  • Brian
1 Like

Hi @suzanne, a response on this post has been tagged as “Solution”. If you have a follow question or concern related to this topic, please remove the Solution tag first by clicking the three dots beside Reply and then untick the check box. Also, we’ve recently launched the Enterprise DNA Forum User Experience Survey, please feel free to answer it and give your insights on how we can further improve the Support forum. Thanks!

@BrianJ always happy to share little tidbits like that :slight_smile:

2 Likes

@Heather It would be awesome if you could post the practical demonstration so we can have comprehensive practical examples in one post.
Great Trick you came up with :+1: :+1:

@MudassirAli, easily done, as @BrianJ had already provided a handy PBIX

both of these visuals are conditionally formatted using the same measure

The measure is very similar to Brian’s, but changes the return values for the switch to return measures:

Cond Format Mom% (2) =
SWITCH( TRUE(),
SELECTEDVALUE( ‘Table’[MoM %] ) < -0.50, [ConditionalColor Lowest],
SELECTEDVALUE( ‘Table’[MoM %] ) < -0.35, [ConditionalColor Mid],
SELECTEDVALUE( ‘Table’[MoM %] ) <= 0, [ConditionalColor Highest],
[ConditionalColor Clear]
)

and the individual color measures are very easy:

ConditionalColor Highest = “#41E194

eDNA Forum - Color CF by Measure Solution (V2).pbix (17.0 KB)

4 Likes

@Heather Thanks a lot for posting it with example and pbix file. This trick is dope :clap:

1 Like

@Heather,

Thanks! - that definitely becomes the construct I’ll use from this point on.

  • Brian
2 Likes

Hi @BrianJ, @Heather, @MudassirAli & @bradsmith,
Trying to take this to the next level. I like the concept of the conditional color, the field is a measure, so selected values didn’t work. ‘If’ did. Have you ever used a table to supply the top and bottom ranges for your ‘if’ or ‘switch’? So you have a table with "Field to conditionally format’, bottom range, top range and color/color value. The idea is to have a table that can be adjusted for ranges by the field/MeasureName you want to conditionlly format. The field/Measure name, would allow you to have one table with the ranges for conditionally formatting different measures. I have added to Heathers example with sample data. Measures in Key Measures, and table of Ranges. If there is a better way to do the ranges feel free to adjust.
Again, I appreciate the feedback.

eDNA Forum - Color CF by Measure Solution V2.pbix (45.6 KB)