Hi @Frankee ,
Totals are sometimes wrongly calculated in Power BI as context is missing for the formulas used, see also the clear explanation of Greg Philps below.
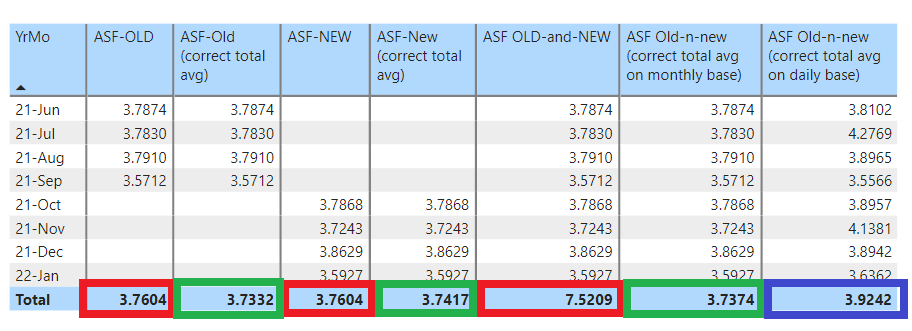
A way to fix the totals in this example using “[ASF-NEW]+[ASF-OLD]” is extending the formula as follows:
ASF Old-n-new (correct total avg on monthly base) = AVERAGEX( VALUES(‘Calendar’[YrMo]), [ASF-NEW] + [ASF-OLD])
which forces the average calculation per each YrMo, and calculates the average of eight YrMo values as result in the total (see also GREEN in forelast column in the picture below)
Be aware that the total presented is an average of averages, which is completely different from a Weighted Average calculation
The totals of ASF-OLD and ASF-NEW are also not correct (see RED in first and third column), and are corrected with the similar formula as above, which give the average of the averages of the four months (GREEN in second and fourth column in picture below)
ASF-New (correct total avg) = AVERAGEX( values(‘Calendar’[YrMo]), [ASF-NEW] )
The average of the total could also be calculated by forced averaging each day (most detailed average possible), which give a different average (in this example based upon 174 daily figures instead of the 8 average monthly figures) (see BLUE in the last column) , using the following formula:
ASF Old-n-new (correct total avg on daily base) = AVERAGEX( ‘Calendar’, [ASF-OLD] + [ASF-NEW] )
PBIX attached:
SamplePBI v2.pbix (229.4 KB)
P.S. Recommended is to merge the tables OLD and NEW in Power Query, with adding a column for the versions, as the data structure (headers) are exactly the same, which reduces the required measures significantly (avoid doubling measures).
Please look for a clear detailed explanation about fixing totals to the post of Greg Philps:
I hope this answers your question,
Kind regards, Jan van der Wind