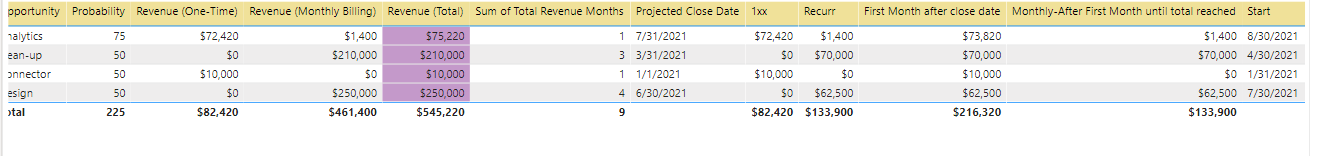
I’ve taken a sample of opportunities where the agreement may involve revenue (one-time) and/or revenue (monthly), both we’d start billing 30 days following the projected close date.
So if it has a one-time revenue, that gets billed 30 days after close in the full amount and if it has a monthly, the monthly billing begins 30 days after close for the monthly. If both, the one time + monthly, then monthly there after. The # of months for the “recurr amount” which is the total divided by months. (in the first opp you’ll it’s both a one time and monthly for 1 month).
So it could have first month amount that differs from the monthly amount. Both are billed (and reflected monthly) until the total (Revenue total) is paid.
I’ve created all of this but then I am stumped at a certain point. (pbix is attached)
Goal: how can I get revenue total per month by opportunity? I have a start date (which is calculated 30 days after projected close) and number of months a monthly amount is charged, first month total and an amount to charge monthly after the first month until I reach the total (in purple). I may have set this up wrong, in pbix, you can see everything after projected close date is calculated columns.
pbix-
excel-under the orange “how do I get this part?” is done manually in excel. how can I accomplish this in power bi?
Any help is appreciated
test.Distribution over months.pbix (175.0 KB) (175.0 KB) testdataexcel.csv (1.7 KB)
Hi @britniblock, we aim to consistently improve the topics being posted on the forum to help you in getting a strong solution faster. While waiting for a response, here are some tips so you can get the most out of the forum and other Enterprise DNA resources.
- Use the forum search to discover if your query has been asked before by another member.
- When posting a topic with formula make sure that it is correctly formatted to preformatted text </>.

- Use the proper category that best describes your topic
- Provide as much context to a question as possible.
- Include the masked demo pbix file, images of the entire scenario you are dealing with, screenshot of the data model, details of how you want to visualize a result, and any other supporting links and details.
I also suggest that you check the forum guideline How To Use The Enterprise DNA Support Forum. Not adhering to it may sometimes cause delay in getting an answer.
Please also check the How To Mask Sensitive Data thread for some tips on how to mask your pbix file.
Hi @britniblock! We noticed that your inquiry was left unsolved for quite some time now. We strive to answer ALL inquiries in the forum. However, if you are sure that you provided all pertinent context to your concerns and read how to use the forum more effectively and still find your question unanswered, you can check out tutorials to learn this yourself as your membership also comes with relevant resources that may help you with your Power BI education.
While our users and experts do as much as reasonable to help you with your inquiries, not all concerns can be attended to especially if there are some learnings to be done. Thank you!