Hello All,
Welcome to “Global Cost Of Living Crisis”
“Sport – Football/Soccer Players Summer Transfers Season 2022-23” was succeeded by 56 entries, 200+ analysis Pages, 650+DAX measures, and 500+ Navigation buttons, bookmarks, and tooltips. Thanks for everyone’s engagement and dedication.
Welcome to EDNA Data Challenge LinkedIn Group
Support Resources:
The Brief
About the dataset/s
 Goal:
Goal:
The goal of this build is to use Power BI to analyze the cost of living data and identify key insights for regions around the world. The build should focus on 2-3 key insights, such as geographic trends or spatial patterns, and use dynamic visualizations to allow the user to easily explore and interact with the data.
Steps:
- Collect and clean the cost of living data. Make sure to check the data for accuracy and completeness, and ensure that it is in a format that can be easily imported into Power BI.
- Create a Power BI report. Use the Power BI interface to design and build a report that effectively visualizes and analyzes the cost of living data. Consider using appropriate visualizations such as maps, scatter plots, or bar charts to highlight key trends and patterns, and use filters and slicers to allow the user to drill down into the data.
- Analyze the cost of living data. In addition to visualizing the data, the report should include a detailed analysis of 2-3 key insights, such as identifying geographic trends or spatial patterns in the data.
- Present the report to an audience. Use the Power BI interface to create a professional and engaging presentation of the report, including clear explanations and examples to help the audience understand the cost of living insights and their implications for the regions in question.
Deliverables:
- A completed Power BI report that effectively visualizes and analyzes the cost of living data and highlights 2-3 key insights.
How to Submit:
-
Log in to your On-Demand Account at https://app.enterprisedna.co/login
- Navigate to the Project Center and Click on Builds
- Pick the build you want to participate in and “Submit Your Build Entry”
- Share an image and a brief description of your report in this forum thread: Global Cost Of Living Crisis
- Share an image of your report to the Enterprise Challenges Group (https://www.linkedin.com/groups/14069197/) with the following hashtags: #EDNADataBuilds, #EDNAGlobalCostOfLiving
Or alternatively, you can email the completed PBIX file and report description to builds@enterprisedna.co
We always encourage all participants to provide a summary with the most insightful, instructional explanation of how they constructed their reports and met their personal learning objectives for the challenge.
If you need any help with publishing, please reach out to one of the team managers for assistance (post in the forum/LinkedIn group) or email builds@enterprisedna.co
Data Set:
How can there be a non-subscriber winner when the first step to submit your report is Login to your On-demand account?
Hi @jgriffit,
Thanks for asking about this.
Good news! The Challenge is now available for free on the On Demand Platform. If you don’t have a subscription, you can still participate by creating a free account and submitting your entries.
So go ahead and give it a try
 Hi Everyone,
This is an entry submitted by Franziola Chui via On Demand.
Here’s how Franziola described it:
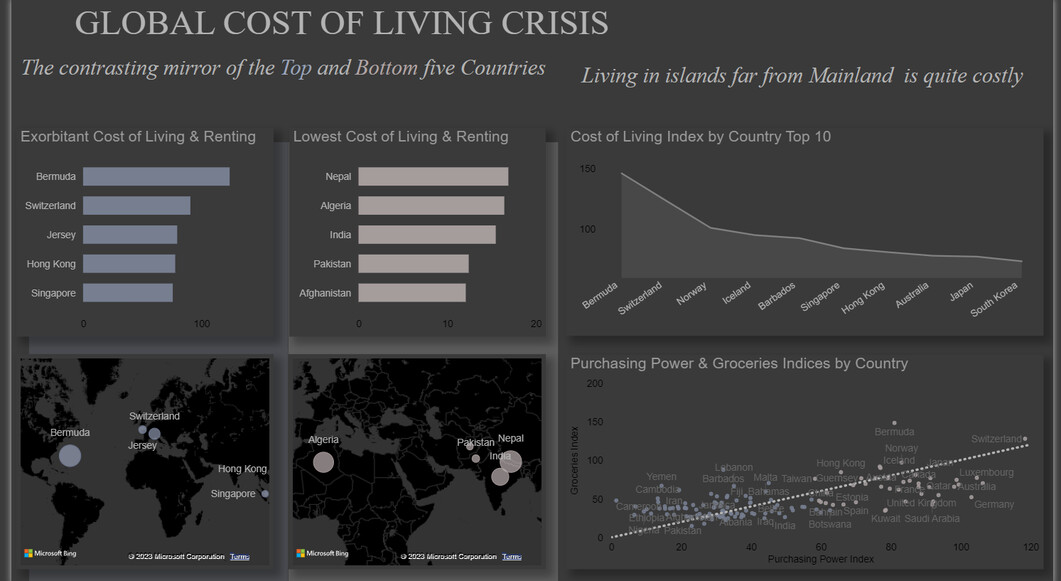
I focused on displaying on a map how together are the Low-Cost Countries and how isolated are the High-Cost Countries.
It was quite challenging having all these indices.
You can view the full report here
Franziola Chiu_C29
Please feel free to give your feedback on his report.
This post is part of the Enterprise DNA platform initiative to provide information about the Power BI Challenge.
To ask any questions on the content covered in this category please start a new topic within the forum. You may check this how-to guide for reference - How To Use The Enterprise DNA Support Forum.
Thank you!
Global Cost of Living crisis.pdf (1.9 MB)
Global Cost of Living crisis.pbix (243.3 KB)
Summary
The report is developed to answer the question. as per requirements.
I focused on displaying on a map to show rank of various country in terms of various index.
To indicate top and bottom ranking.
Perform cluster analysis based on Index rank.
1 Like