**Welcome to “Time Intelligence - Highlighting Trends”
“Sport – Football/Soccer Players Summer Transfers Season 2022-23” was succeeded by 56 entries, 200+ analysis Pages, 650+DAX measures, and 500+ Navigation buttons, bookmarks, and tooltips. Thanks for everyone’s engagement and dedication.
The goal of this Build is to create a Power BI report that clearly visualizes and analyzes a divergence in trends over time. The report should make it easy for the user to understand the reasons behind the divergence and take appropriate action to address the issue.
Steps:
Identify a trend divergence to visualize and analyze. This could be any data trend that shows a significant difference between two measures over time, such as sales revenue and customer satisfaction, or product demand and supply.
Collect and clean the necessary data.
Create a Power BI report. Use the Power BI interface to design and build a report that showcases the trend divergence using appropriate visualizations and analysis techniques. Make sure to include data labels and markers to highlight specific points of interest.
Analyze the trend divergence. In addition to visualizing the trend divergence, the report should include a detailed analysis of the potential contributing factors and recommendations for addressing the issue. This could involve comparing the trend divergence to external market conditions or conducting statistical analysis to identify correlations.
Present the report to an audience. Use the Power BI interface to create a professional and engaging presentation of the report, including clear explanations and examples to help the audience understand the trend divergence and the proposed solutions.
Deliverables:
A completed Power BI report that showcases a trend divergence and provides detailed analysis and recommendations for addressing the issue.
Share an image of your report to the Enterprise Challenges Group (https://www.linkedin.com/groups/14069197/) with the following hashtags: #EDNADataBuilds, #EDNATimeIntelligenceHighlightingTrends
Or alternatively, you can email the completed PBIX file and report description to builds@enterprisedna.co
We always encourage all participants to provide a summary with the most insightful, instructional explanation of how they constructed their reports and met their personal learning objectives for the challenge.
If you need any help with publishing, please reach out to one of the team managers for assistance (post in the forum/LinkedIn group) or email builds@enterprisedna.co
HNY, just double checking if the dataset attached in this challenge is the right one to use. Asking because the only relevant numeric field in the dataset is “Individuals Affected” and no other fields can be use to highlight measures over time, such as sales revenue and customer satisfaction, or product demand and supply as stated in the brief.
Hello, we have reviewed and uploaded the revised data sets. Please obtain the updated file and do not hesitate to contact us if you have any questions or require further clarification. Thank you.
This is an entry submitted by Damian Wolowiec (@Gervith) via On Demand.
Here’s how Damian Wolowiec described it:
This challenge strongly encourages, or even forces, the use of data intelligence functions. At first glance, it seemed that the task would be simple and quick, but nothing could be further from the truth. Drilling down further, interesting conclusions could be drawn, and legitimate recommendations could be offered.
I used several concepts to create this 3-page report:
neon design, which is unique, I wanted the report to stand out, it is not necessarily ideal for business, but challenge allow us to let our imagination carry us away
time intelligence functions, which I supported with functions such as use relationship and treats with respect to dates
flags that show the highest value on the chart which allows us to focus on relevant information
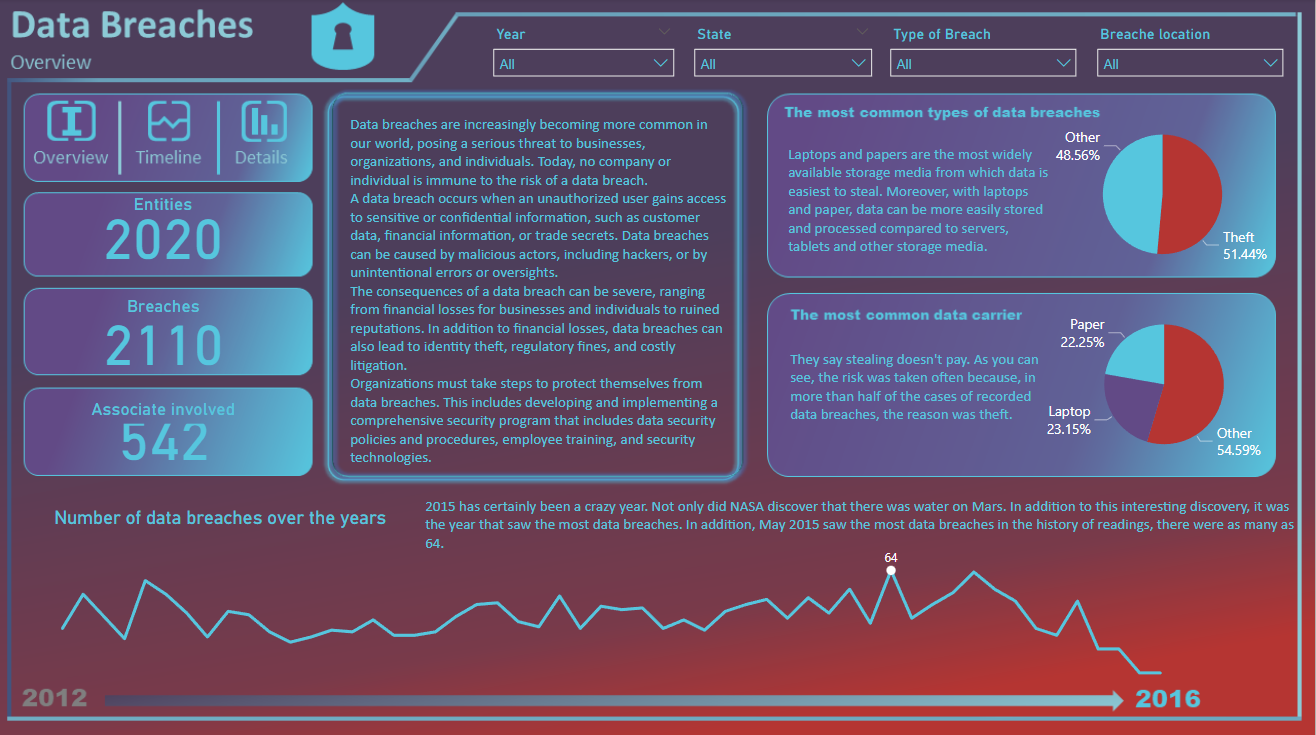
Here is an entry submitted by Lonneke Opsteegh via On Demand.
Here’s how Lonneke described it:
Even though I design numerous dashboards, I never made a dark-theme before. However, I thought it matched the content of the dashboard.
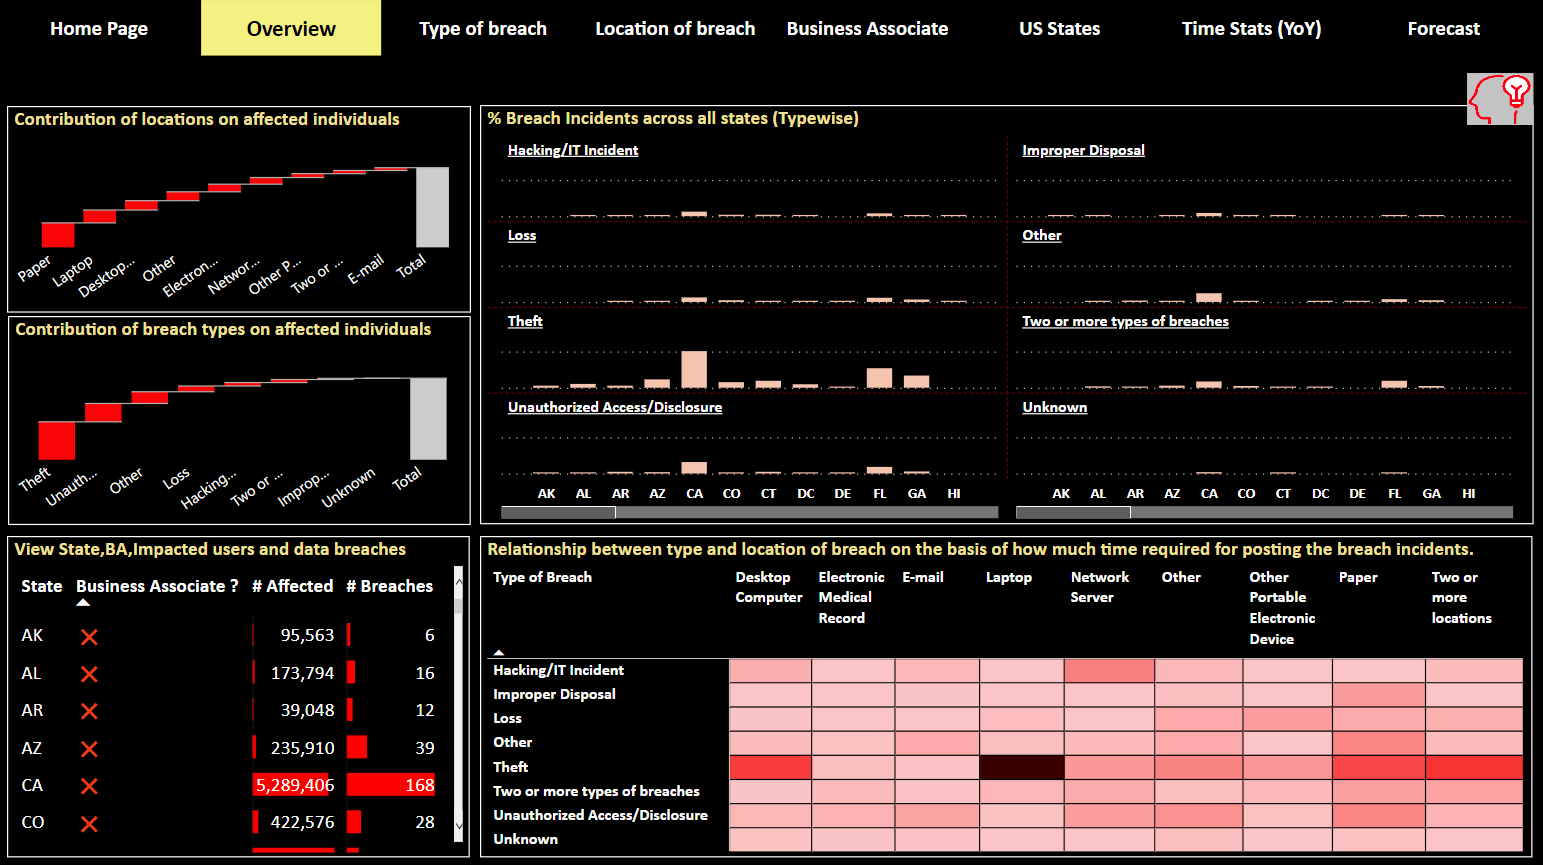
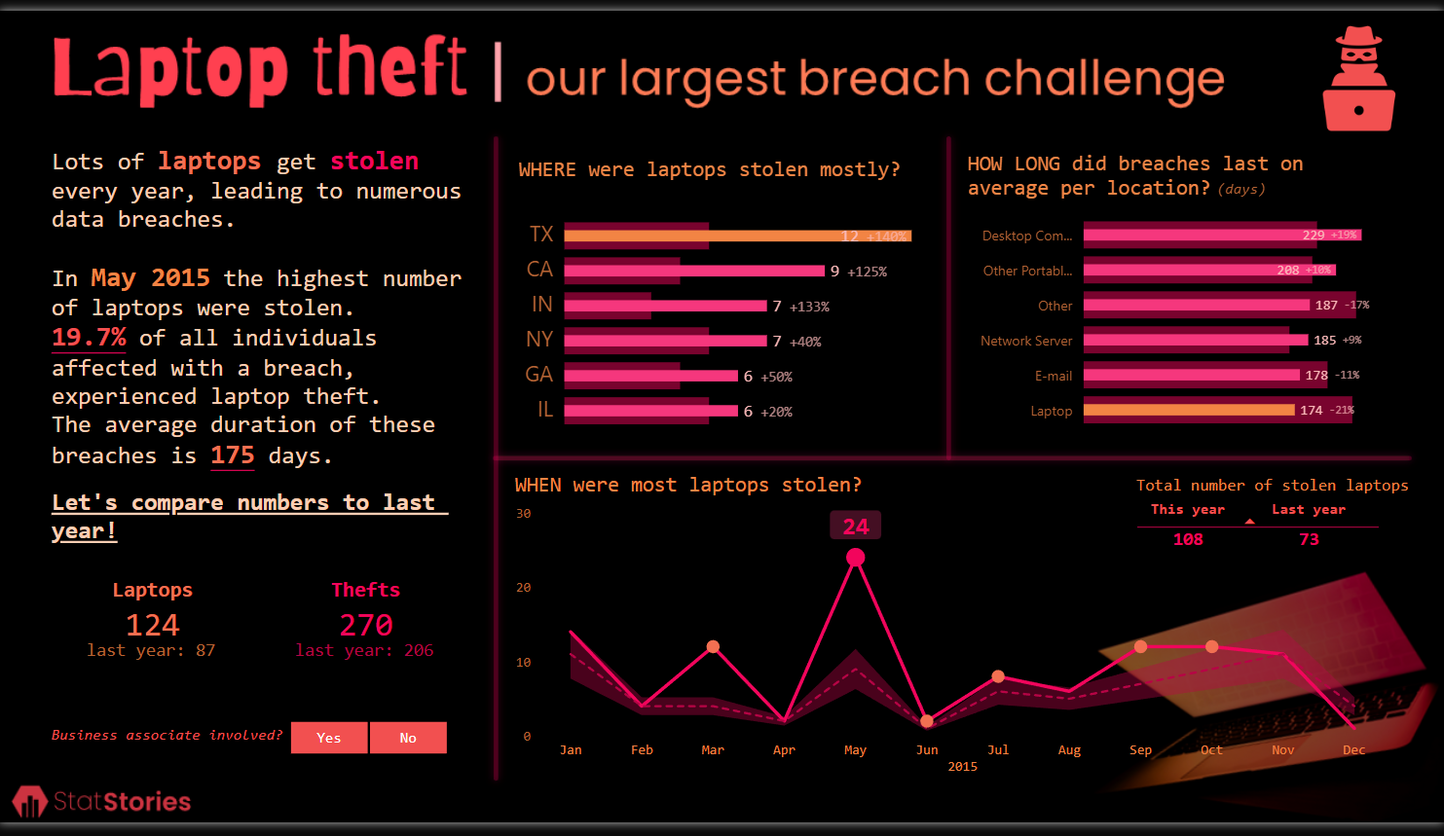
Based on a heatmap with types of breaches and location of breaches, I found with combination resulted in most breaches. After that, I searched in what year most of these breaches occurred and focused my dashboard on that combination of selections.
I compared values of the specified year (2015) with the year before.
This post is part of the Enterprise DNA platform initiative to provide information about the Power BI Challenge.
To ask any questions on the content covered in this category please start a new topic within the forum. You may check this how-to guide for reference - How To Use The Enterprise DNA Support Forum.
I am sharing my report for Challenge 25 – Time Intelligence – Highlighting trends.
Here’s the link for the report:
I put together a two-page report, with the first page providing an overview of the dataset and focusing on the number of ongoing breaches and ongoing affected individuals.
On the second page I created a “what-if” analysis. This allows for exploring how the number of breaches would evolve based on expected trends for started and ended breaches.
Overall, I am quite happy with the report and I feel like I learned a lot about time intelligence. However, it also highlighted that I still have work to do with my time management and I should have started working on this report earlier