We’re bringing to you a new dataset update, only for platform members.
Our CEO, @sam.mckay has made some changes in the dataset giving us the opportunitty to exercise Trends and & Time comparison analysis with Enterprise DNA YouTube Data in Challenge 21.
This dataset can be used in combination with the previosuly provided datasets or as a standalone dataset.
The choice is yours!!
I hope you like the improved dataset and I hope to see your entry in the challenge soon.
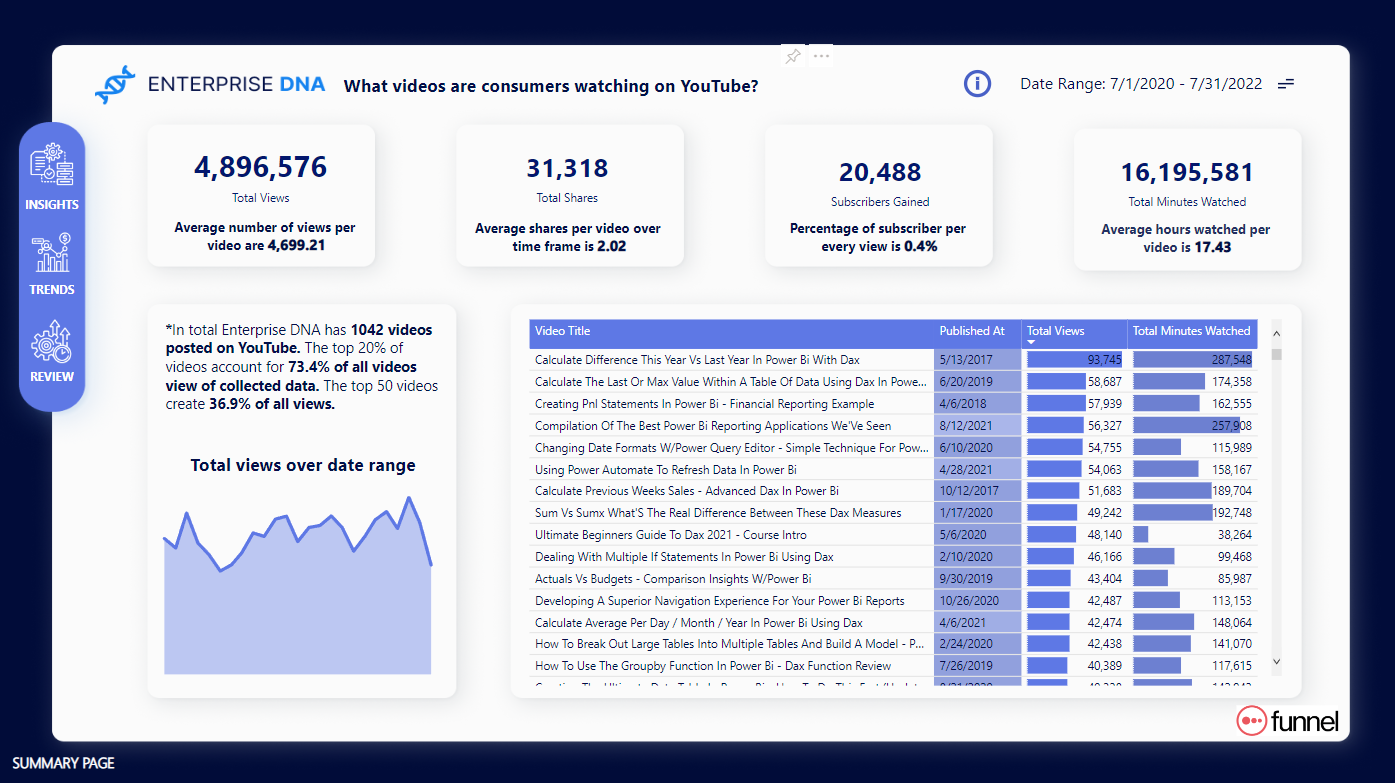
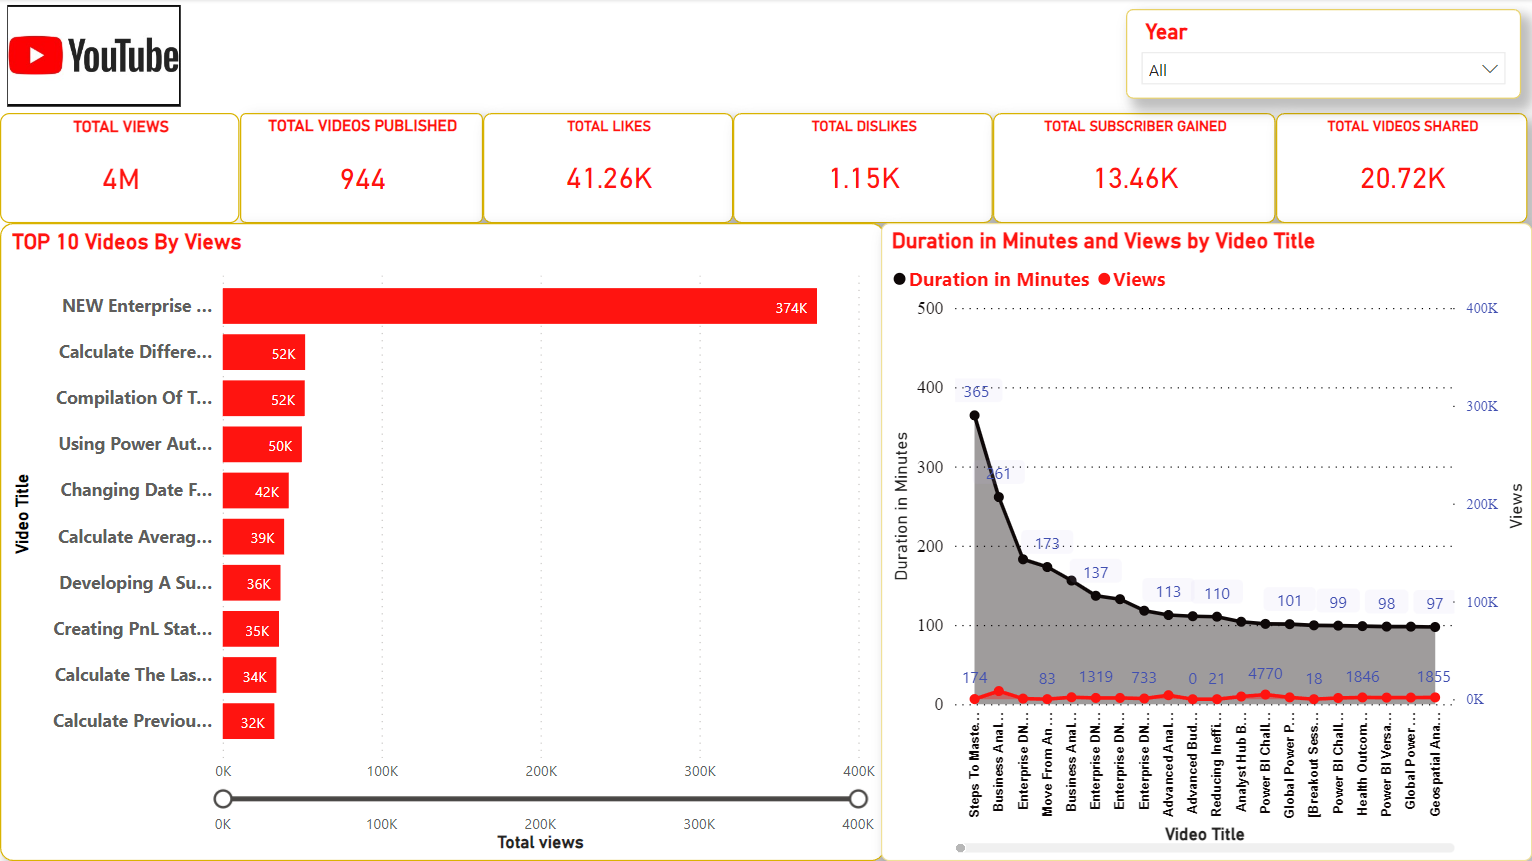
Not too many fancy visuals, just solid insights is what I was going for.
I used an advanced theme template (from Analyst Hub) to really speed up my development. It saved me so much time on my visuals and report design. It’s crazy! I won’t create reports any other way now.
There’s much more I’d like to analyze, but I can’t wait to see others ideas
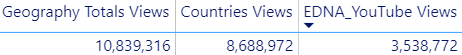
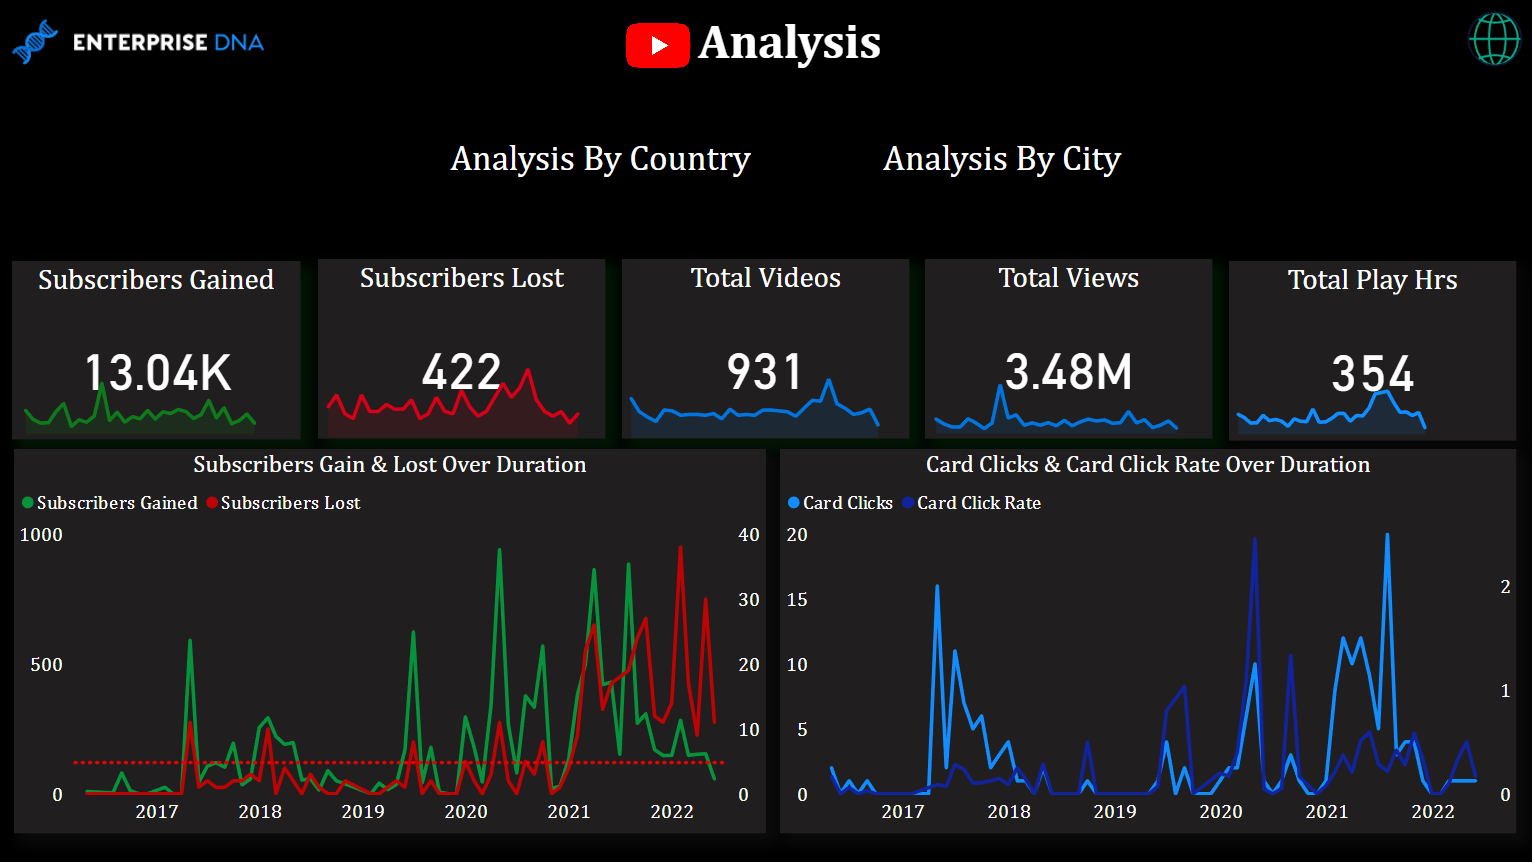
Any explanation for the 300% difference between the views in the Totals tab of Geography (10.8M), the Countries tab in Geography (8.7M) and those in the main dataset (3.5M)? The 3.5M includes the outlier ad video, so that isn’t the reason. The Totals tab should be the sum of the Chart Data (which has dates), but it is 2.2M off. This is really throwing off some analyses!
(This doesn’t include the latest dataset published yesterday, which still isn’t anywhere close to the 10.8M)
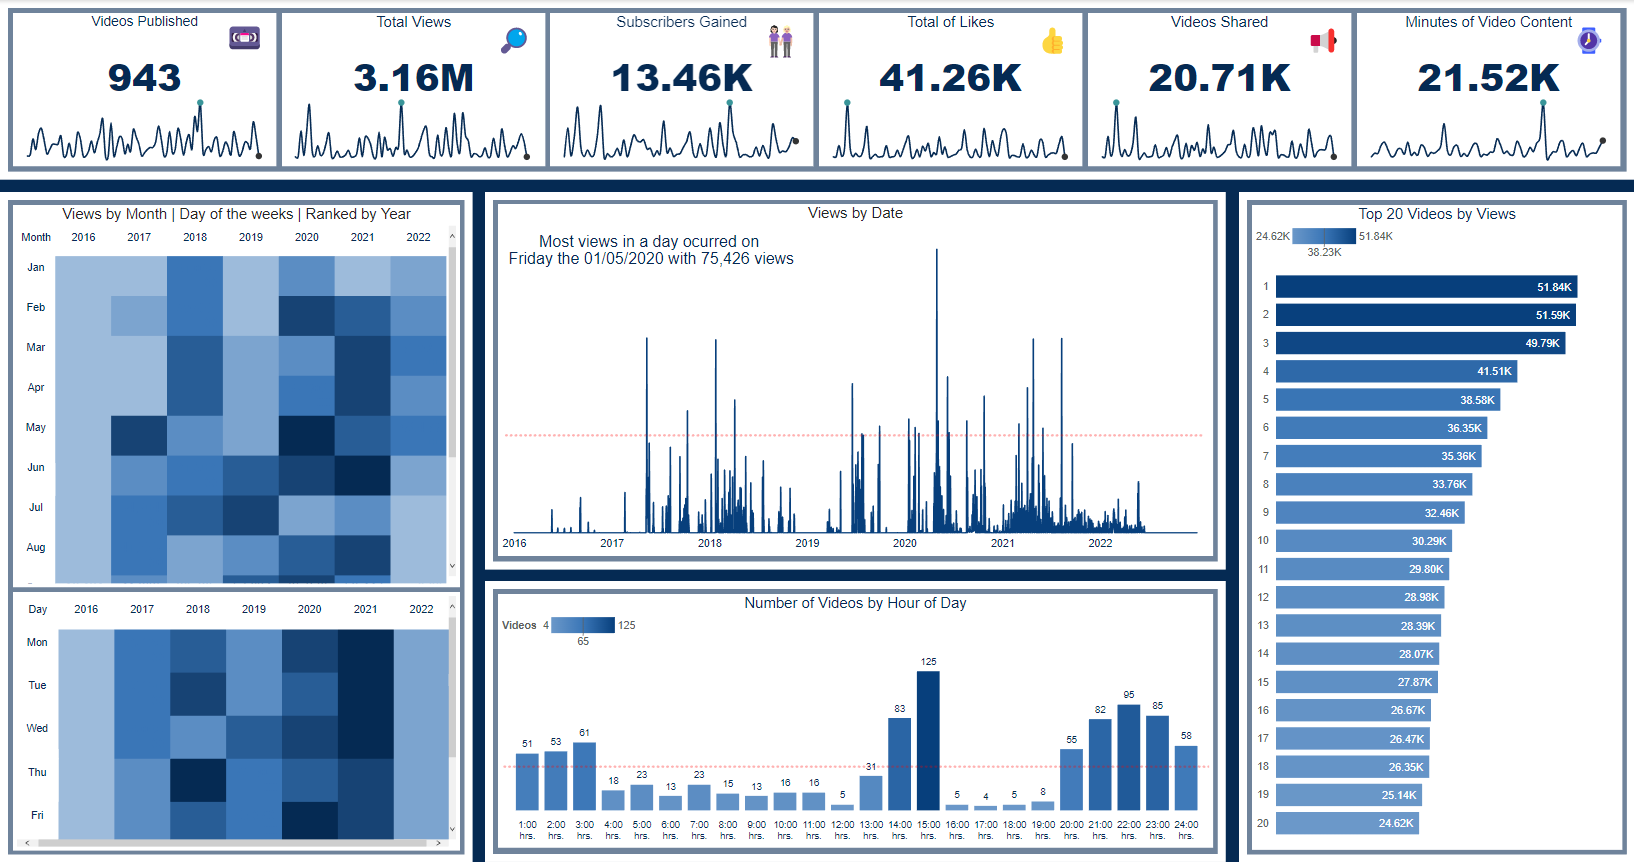
Thank you Sam, I love the theme and colour palette…the Analysis coming from you is also very inspiring where less is more and a simple display of charts and matrixes do an excellent work.
The first and thirds datasets come from different sources (Funnell) - the latest dataset is the one that Sam McKay uses for his presentation.
The second datasets come directly from the you tube channel.
I will not try to match the information, we knew of the discrepancies and it also show how data taken from different sources can be sometimes confusing.
The analysis for this challenge is exploratory in nature, where these discrepancies are to be shown or you just can pick one the datasets, I recomend the first or third one, and produce an overview of the data provided.
It is indicated in the brief and other documents in the challenges that the data is not to be explored or match together but work as indepedent datasets with different outcomes.
Hi everyone, this is an entry submitted by Veronica Aides sent to us via email.
Here’s how Veronica described it:
“This is my first submission in this challenge, it was very exciting to analyze this new Dataset in Desktop and Mobile versions. I have a lot to learn yet. Thanks for the opportunity!"
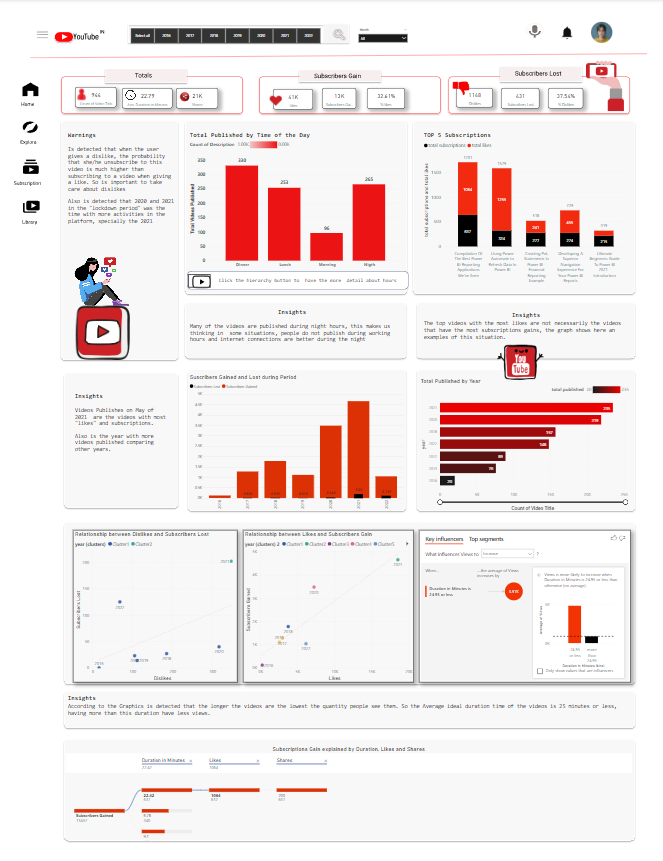
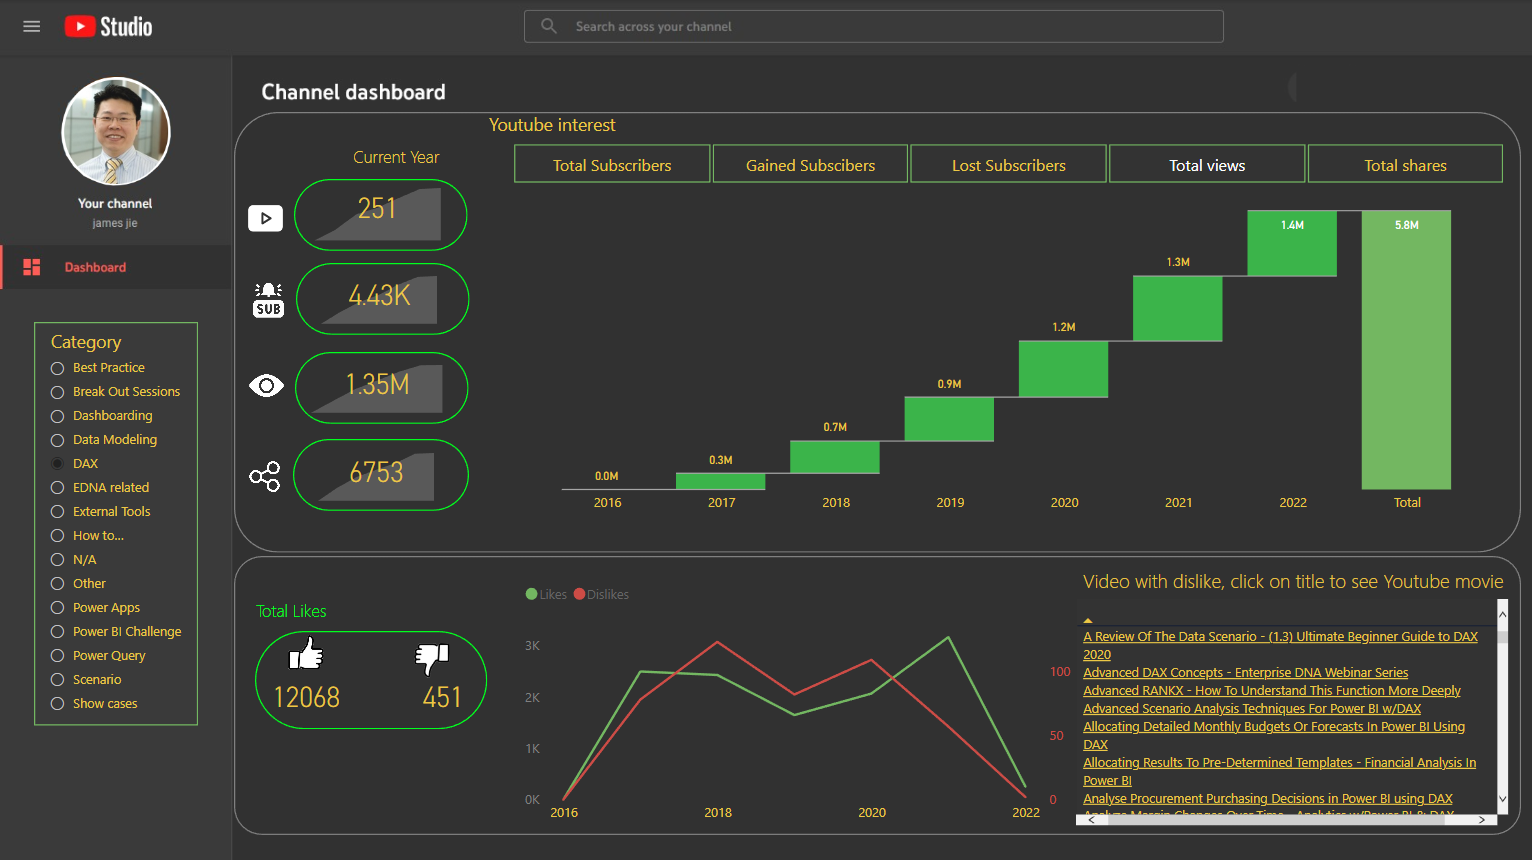
Hi everyone, this is an entry submitted by Sibi Maran sent to us via email.
Here’s how Sibi described it:
I focused on preparing a report that enables the user to analyze multiple metrics across different timelines and videos. Also, I want the report to be simple to interact with and navigate"
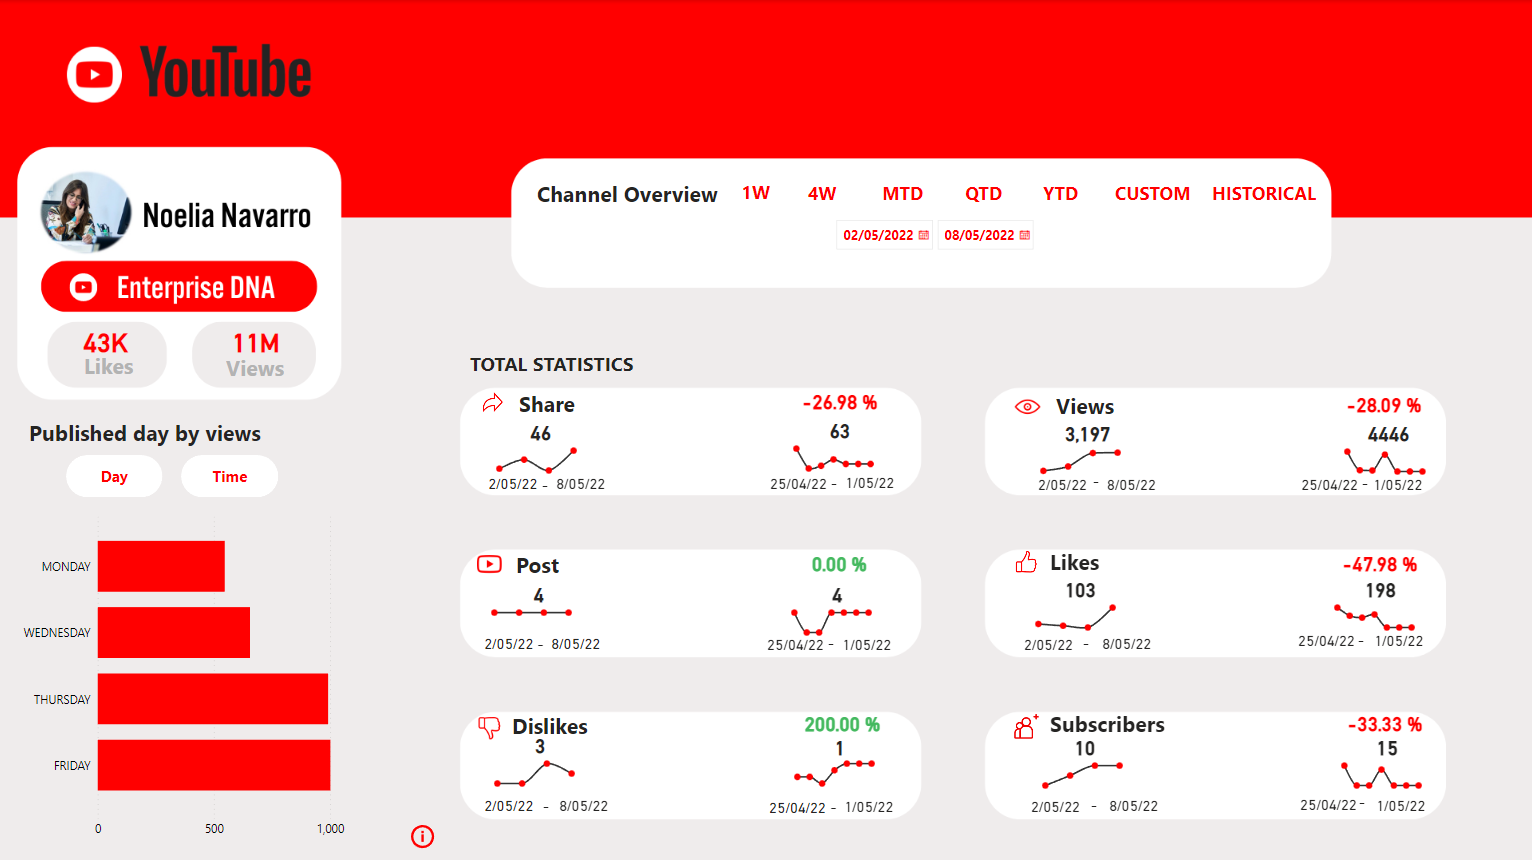
Hi everyone, this is an entry submitted by Noelia Navarro sent to us via email.
Here’s how Noelia described it:
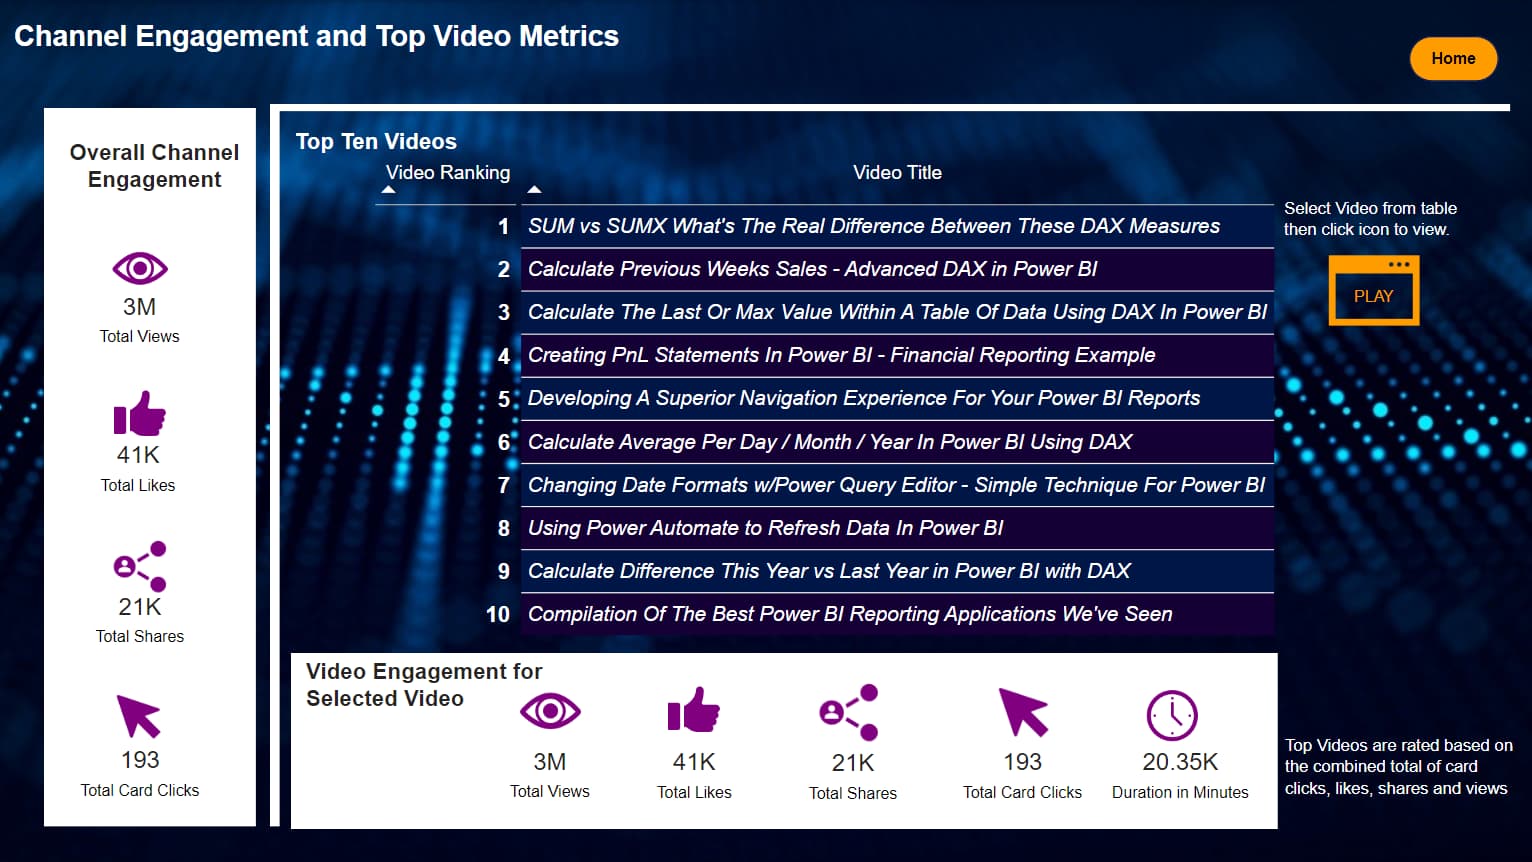
This is my first submission to eDNA challenges. It has been a lot of fun analyzing the data from eDNA’s YouTube Channel. I have tried to simulate the Shield app
Thanks for sharing @sam.mckay. It helps me to have an understanding of what to look at in the data.
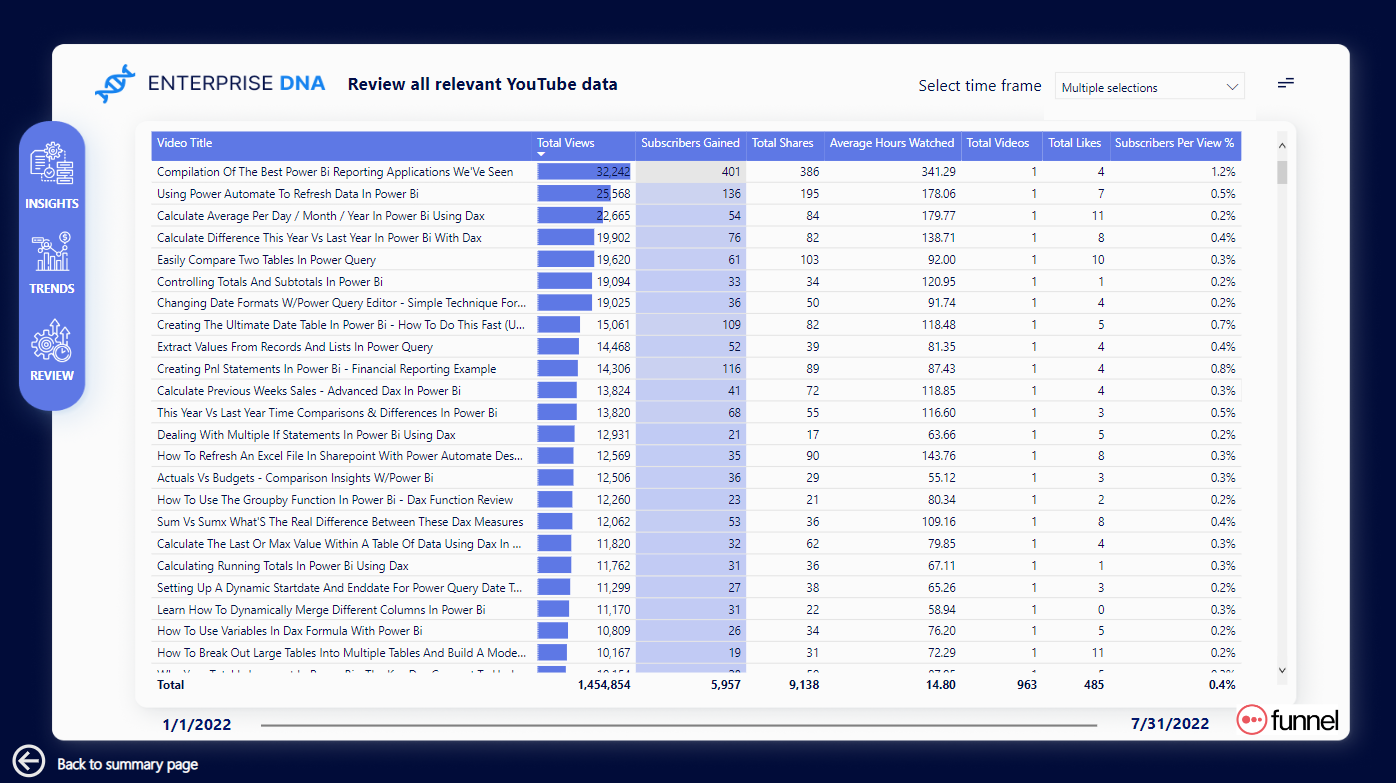
What do you mean by average hours watched on the review Page when you are looking at the value for a single video on the table? In that case, as it is only one video is it the same as the total hours watched?
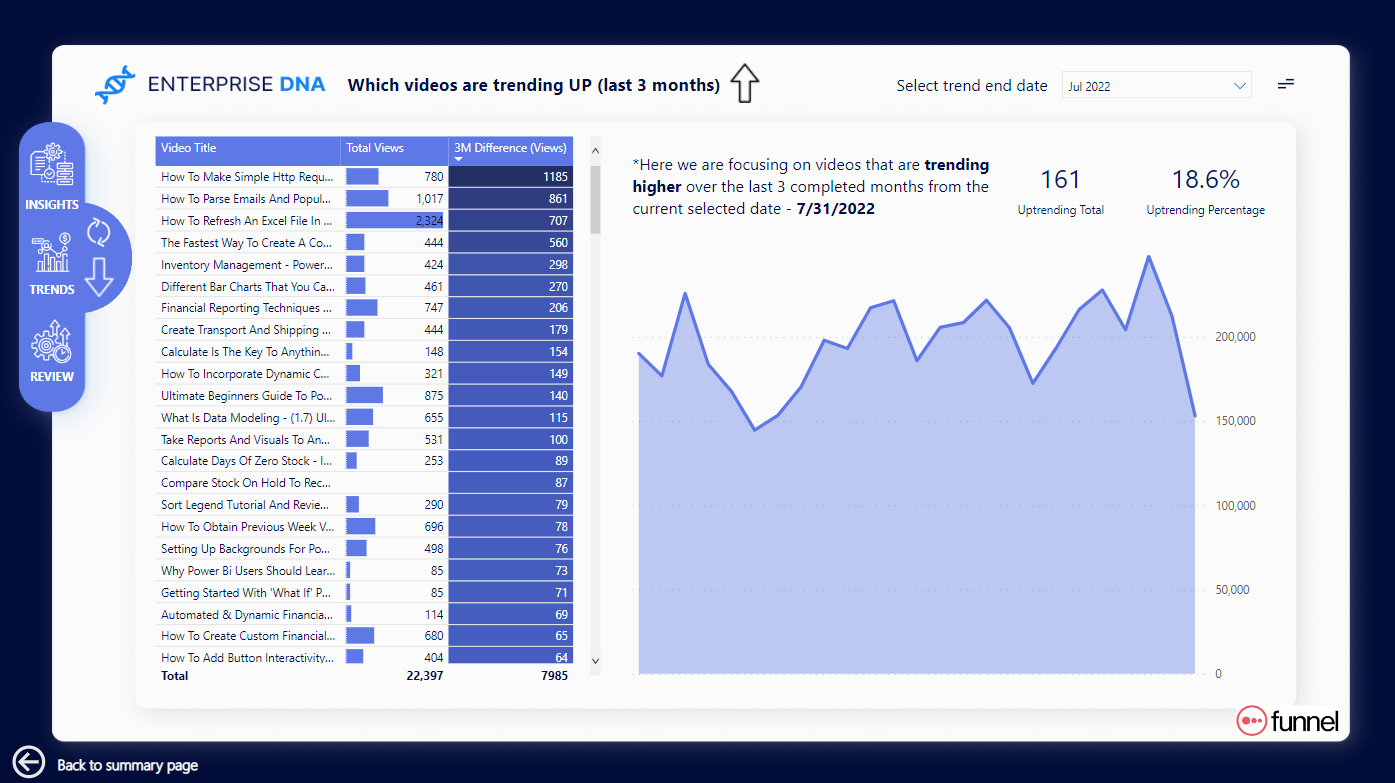
Could you please explain to me, what it means the trending Up and Down, over the last 3 months? i.e: On Trending Up, for How To Make Simple Http Requests In Power Automate on Trend end Date Jul 2022. In Total View is 780 but the 3M Difference (Views) is 1185. I think my doubt starts due to not understanding of what is the 3 months Difference Views. I´m understanding that means the growth of Views over the last 3 months but that´s not possible if the Total Views are 780.
Looking forward to hearing your comments
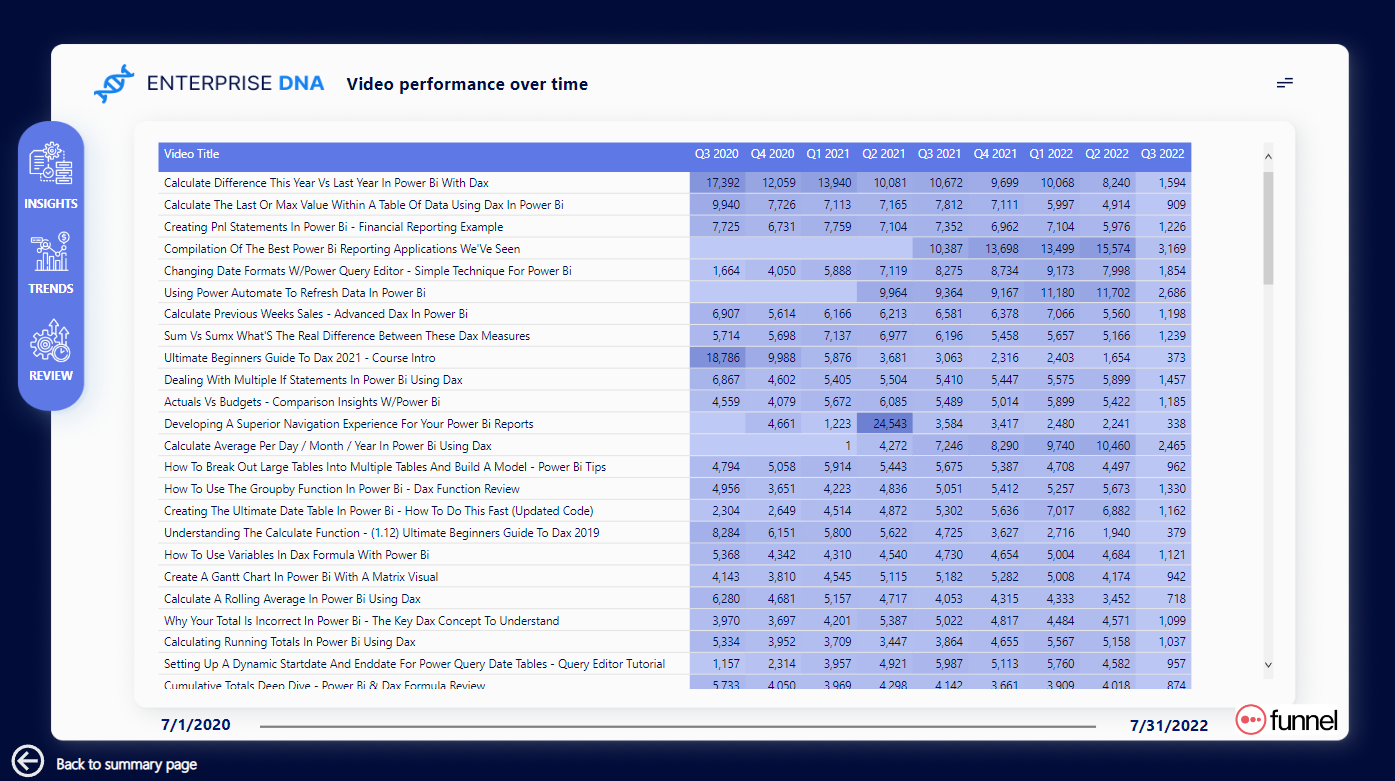
@FPastor what does it mean for each row of that new file? For me, it seems that each month after the video was published it shows a summary of what happened with the video in that particular month. However, I check it and is not 100% true for all of the videos.
What is the column Duration (Time)?
Videos Added To Playlist means that on the Playlist the video is located on that month how many videos were added?
Thanks
Thank you for your question, I would like to draw your attention to the type of Analysis you are carrying out, Exploratory Data Analysys (EDA). As such one of yours tasks, outside provide some visuals and metrics, is also to poinpoint discrepancies and irregularities in the data analised. Another area or work to be carried out is a data Q&A (Quality & Assurance), I think you are doing this very well by asking these questions here and in the challenges group.
My asnwer to you will be to ensure these findings are annotated withinin your report and or explain in your report write up when submitting.
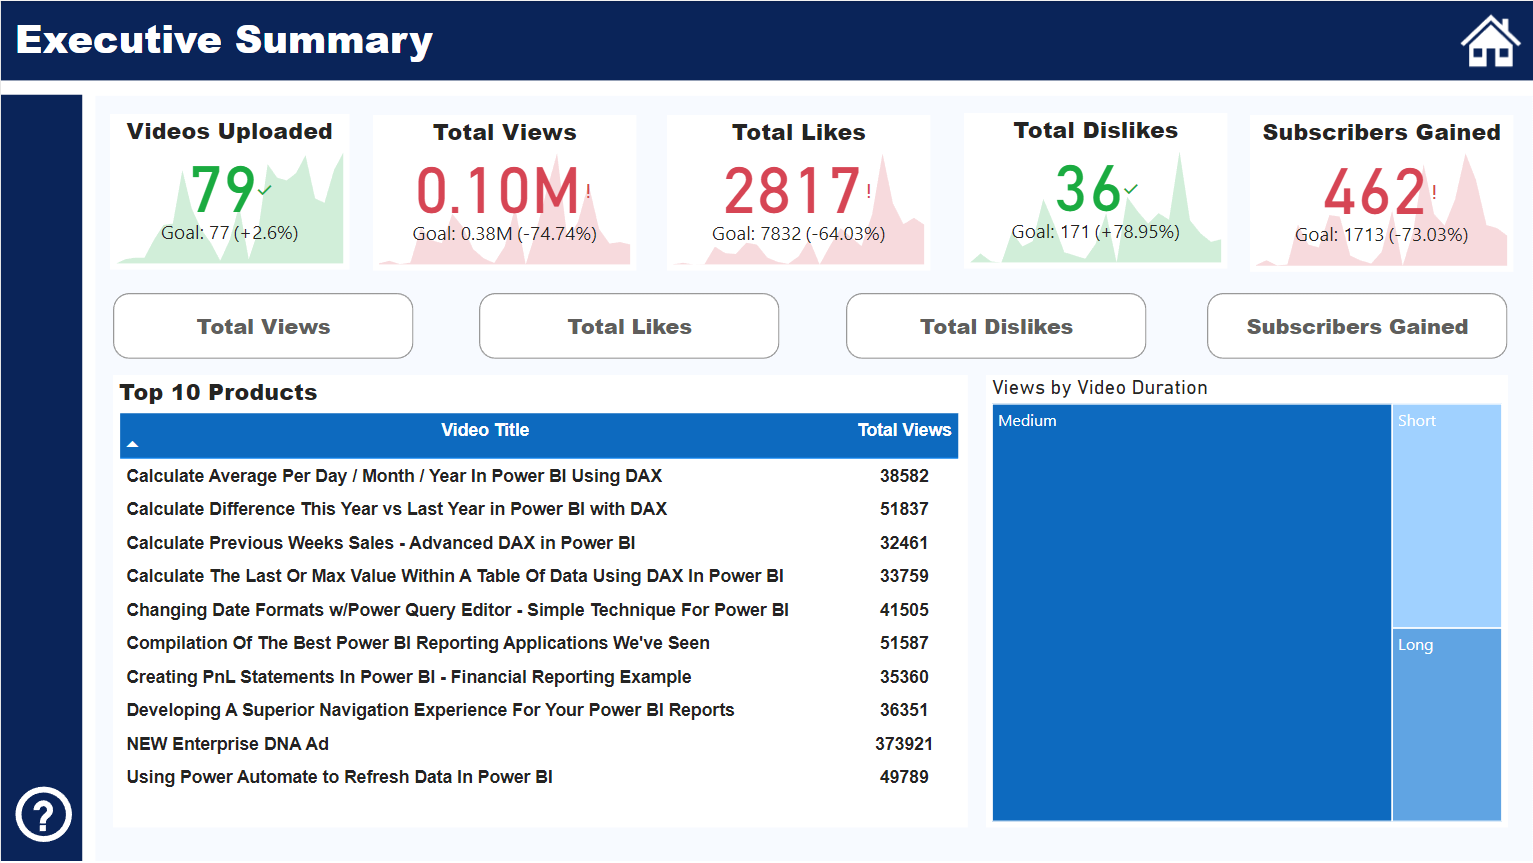
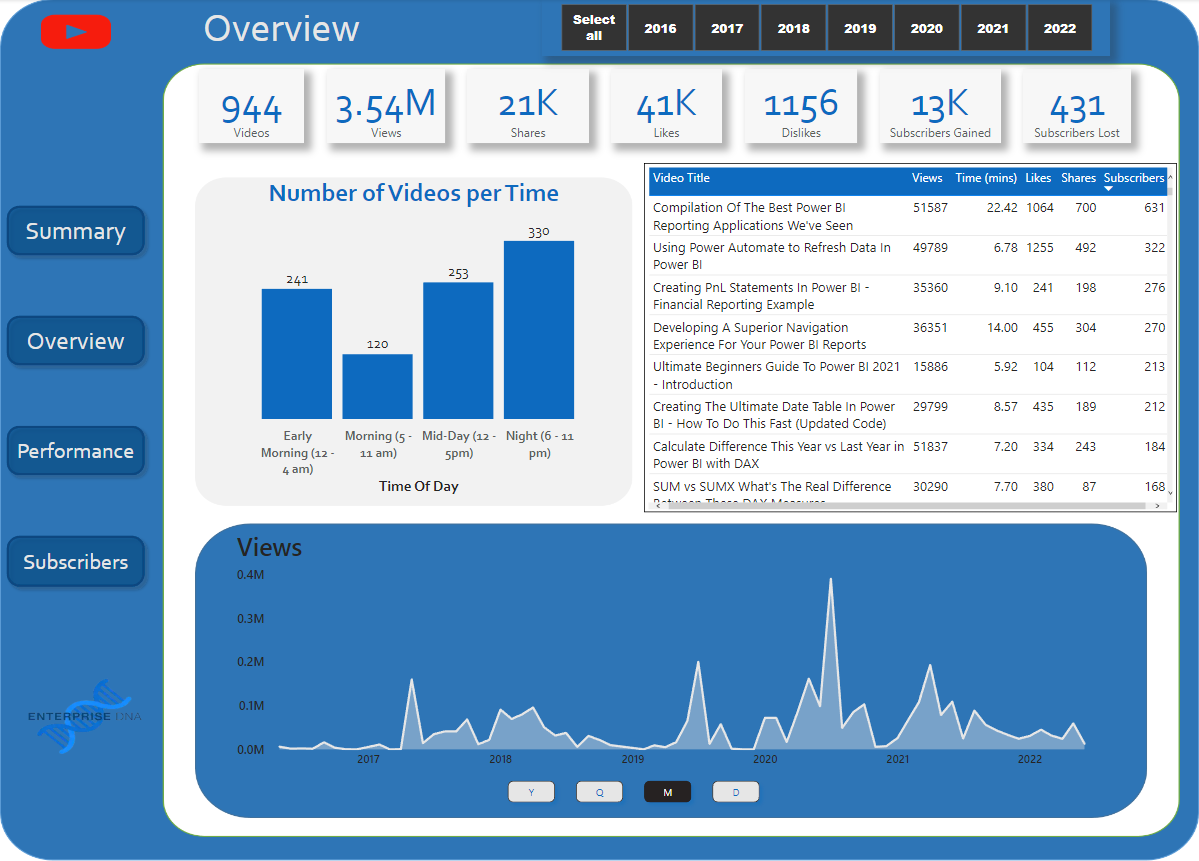
Hi everyone, this is an entry submitted by Erika Liljestrand sent to us via email.
Here’s how Erika described it:
This is my first challenge. I have been learning and using Power Bi for only a few months, so I appreciated the openness of this challenge as it let me practice what I was able to figure out.
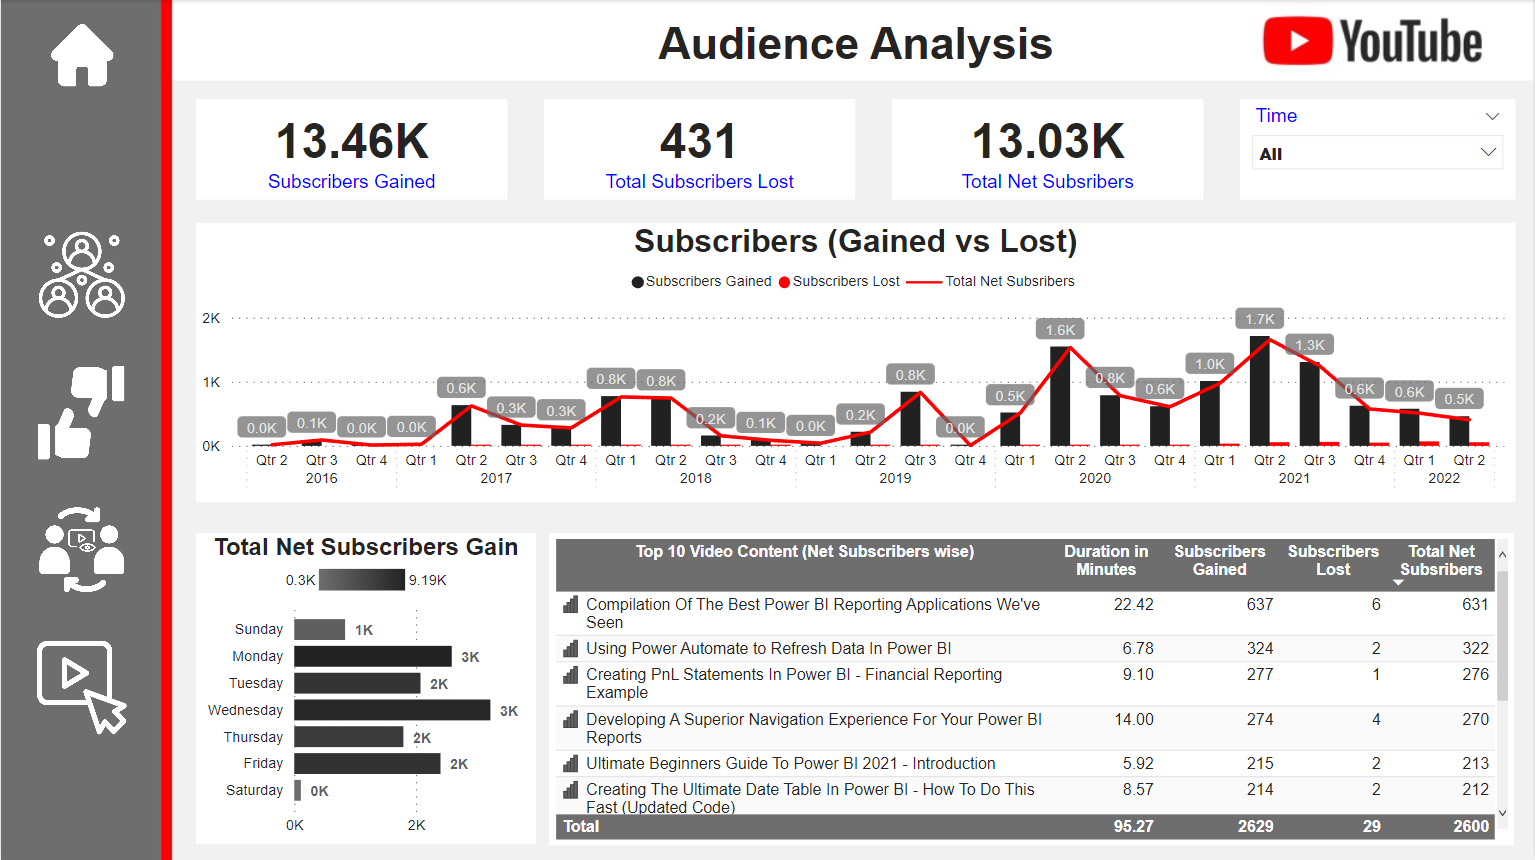
Hi everyone, this is an entry submitted by Rakesh Bedge to us via email
Here’s how Rakesh described it:
On weekend I created the Enterprise DNA YouTube Channel Data Analysis Dashboard. I enjoyed the dashboard building process and try to create youtube theme dashboard.