Hi Frederico / @FPastor ,
Many thanks for your valuable feedback. Manage to change this. Hope this will work now.
Best regards,
Maja
Hi Frederico / @FPastor ,
Many thanks for your valuable feedback. Manage to change this. Hope this will work now.
Best regards,
Maja
Hello, everyone,
I’m parsing the data to answer the question:
How many shortages of orders (compare Sales Orders vs Finished Goods Inventory?
In the Sales Orders table we have the Quantity column that tells us the amount we have of each product in inventory.
If we combine this table with the Finished Goods Inventory table through the product code, we see that this amount coincides with the Closing field of the latter for all records except 25 products, as previously discussed in the forum.
These 25 products are not in the finished goods inventory but we have the information we need on the number of Sales Orders.
I consider that it is not necessary to compare the Sales Orders table with the Finished Goods Inventory table since the quantity information in the Sales Orders table is correct.
To understand the information in the Finished Goods Inventory table, is the date 05/24/2022 the date on which the inventory was obtained?
This date is after the sales order information, which is for 05/05/2022, so does it make sense to combine these two tables?
Are the fields Opening, Produced, Consumed and Closing the quantities for the day 05/24/2022?
Are we going to have this information daily?
In the case of records in which it is not true that the closing amount does not coincide with the opening amount plus the amount produced minus the amount consumed, should we correct these inconsistencies by creating a calculated column or a calculated column indicating that there is an error in this calculation?
Regards
Great work @mspanic !
I like the way you decided to show the anotations below every topic in the main page, really useful. Same for the tooltip about the product, I think that’s a really good way to present more details.
The structure of the visuals you used to give an answer about the “Shorting” is really similar to mine! Now I’m sure that the approach about that topic is good!
PD: Try to revise the Info Button bookmark in “Produced vs Forecast”, at least in my case the window is opened in an incorrect position 
After seeing different numbers in the submissions, I decided to revise the measures used in my model and while digging into the dataset I realized that I may have a mistake calculating the Quantity of products with NO sales.
For some reason my first approach was to compare the closing column in Finished Goods Inventory (>0) with the Consumed column (0) , as I show in the following measure:
The result in this case is 64.
LowSales - # Products 0 Sales - First Approach =
VAR _InventorySales =
FILTER(
    ADDCOLUMNS(
        SUMMARIZE('Products'
            ,'Products'[Product])
        , "@Inventory", SUMX( RELATEDTABLE('Finished Goods Inventory'), 'Finished Goods Inventory'[Closing])+0
        , "@SalesOrder", SUMX( RELATEDTABLE('Finished Goods Inventory'), 'Finished Goods Inventory'[Consumed])*-1+0
        )
, [@Inventory] > 0 && [@SalesOrder] <= 0
 )
RETURN
COUNTX(_InventorySales, [Product])
After revising it, I decided to compare the products that has 0 qty in Sales Order vs the Products with a closing inventory over 0, as I detail in the following measure:
The result in this case is 52.
LowSales - # Products 0 Sales - Revised Approach =
VAR _InventorySales =
FILTER(
    ADDCOLUMNS(
        SUMMARIZE('Products'
            ,'Products'[Product])
        , "@Inventory", SUMX( RELATEDTABLE('Finished Goods Inventory'), 'Finished Goods Inventory'[Closing])+0
        , "@SalesOrder", SUMX( RELATEDTABLE('Sales Orders'), 'Sales Orders'[Value])+0
        )
, [@Inventory] > 0 && [@SalesOrder] <= 0
 )
RETURN
COUNTX(_InventorySales, [Product])
How did you calculate the Products with NO Sales?
Hi,
It appears that I missed this one, please copying the data owner for clarification.
Can you please help with Jose’s question.
Thanks and regards,
Federico
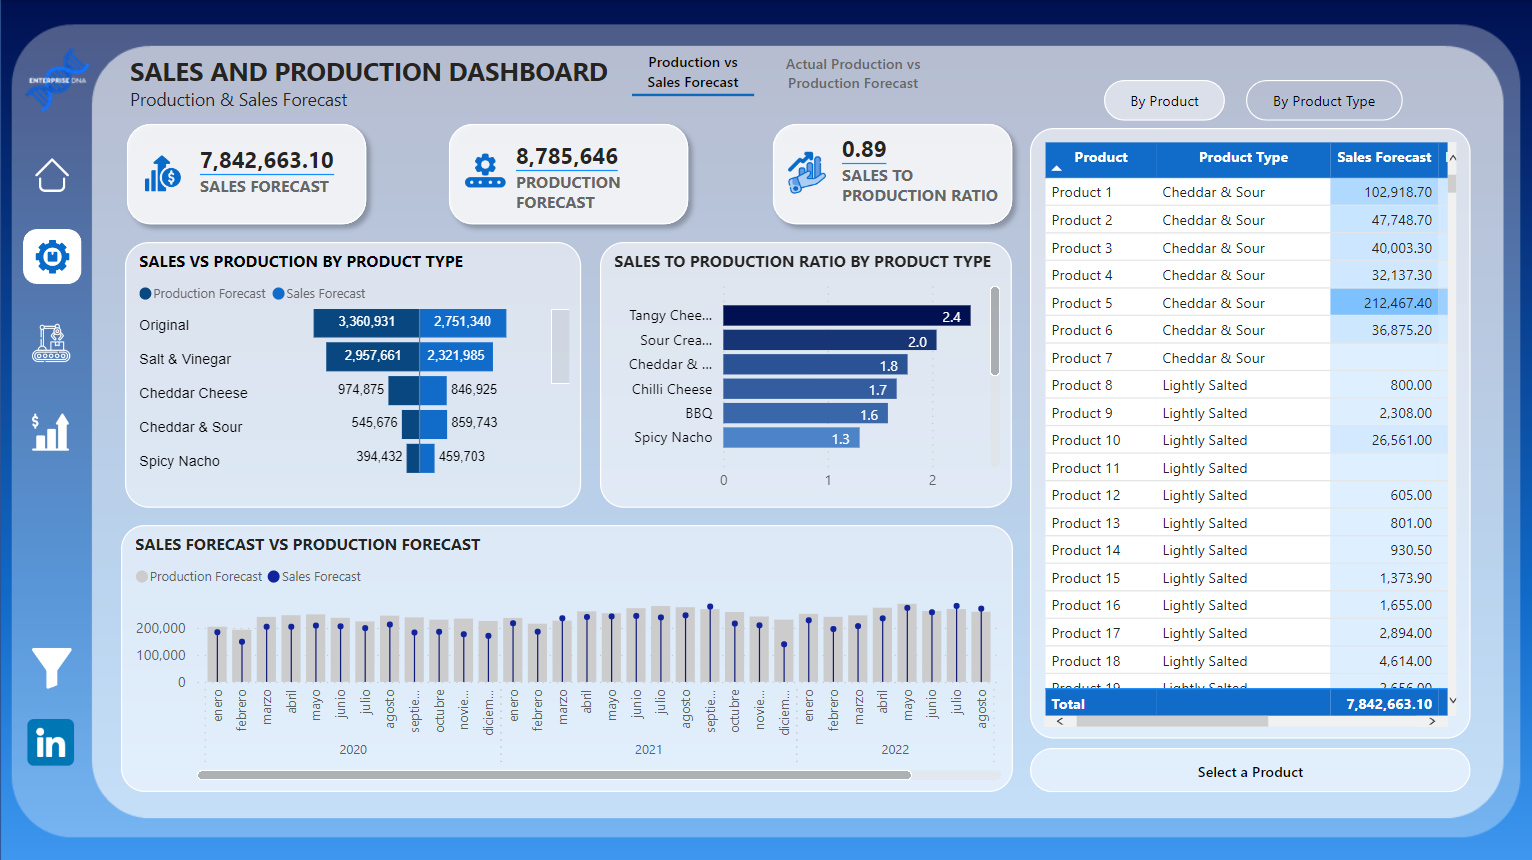
Hi everyone, this is an entry submitted by Camilo Corrales sent to us via email.
Here’s how Camilo described it:
Hi everybody. I accepted the Enterprise DNA challenge.
This is my first ever entry to an EDNA Challenge and i feel it was really challenging, i tried to create a report that solves every single question that the end user can have about the dataset (At least all the questions that i thought about) so I used multiple techniques to make the report more interactive, like multiple bookmarks and DrillThroughs.
I really enjoy being exposed and accepting different challenges because it allows me to get my hands on multiple datasets from different industries that need different approaches. For this specific challenge i made a lot of research about inventory management kpis and metrics.
I invite you to navigate the report and provide feedback it will be very welcomed by me. Thanks again to the Team for the opportunity and providing this dataset!
It was very rewarding experience. Thank you for the opportunity to participate! Best of luck to all the participants!
You may view the full report here:
Camilo Corrales
Please feel free to give Camilo your feedback on his report.
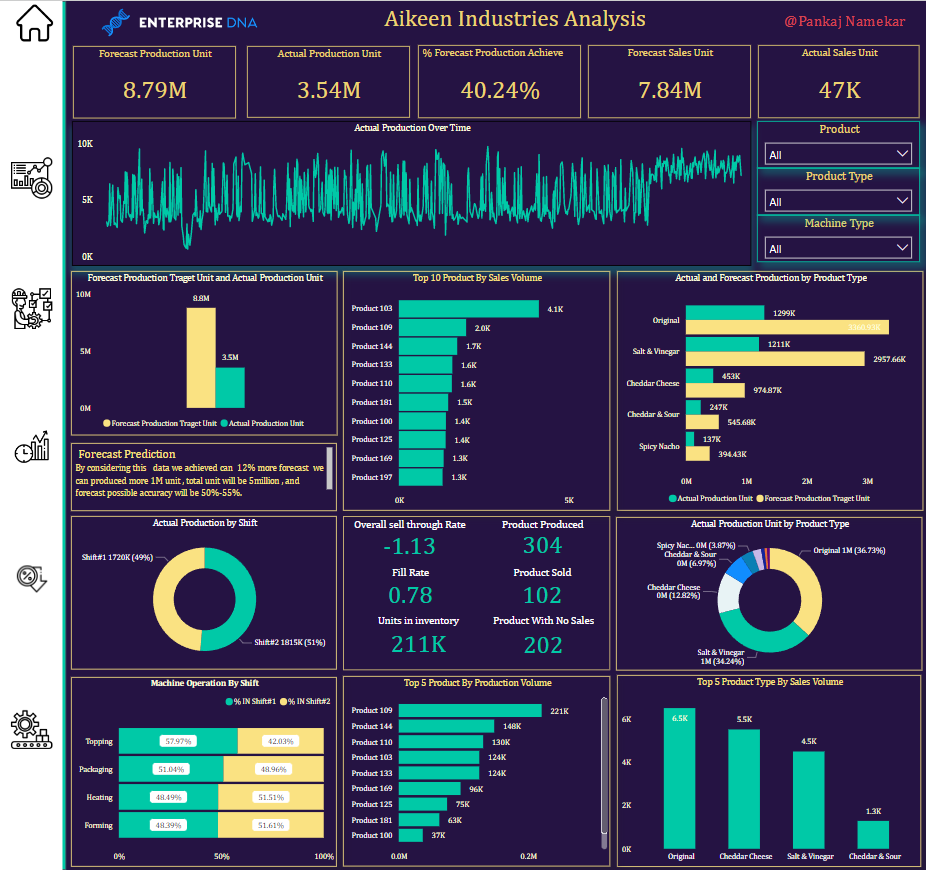
Hi everyone, this is an entry submitted by Pankaj Namekar sent to us via email.
Here’s how Pankaj described it:
This weekend with Enterprise DNA Ltd for Aikeen Industries Analysis
Most challenging thing for me . in short before performing an analysis of any industry you must have deep knowledge about that business.
Without proper understanding you are not able to generate proper insights.
Must have knowledge about
1-Key business area.
2-Business Pain.
3-How business operate
4-Factror affecting on business
5-Performamce in various area.
I Learn lot from this challenge , I want to say thank you Sam McKay, CFA
Federico Pastor and team.
Overall Experience with Enterprise DNA Ltd
You may view the full report here:
Pankaj Namekar
Please feel free to give Pankaj your feedback on his report.
Hey everyone as we count down to the end of data challenge 20, we understand that the data complexity might take everyone too much time to work on it. So please read below announcement:
𝗪𝗲 𝘁𝗿𝘆 𝗼𝘂𝗿 𝗯𝗲𝘀𝘁 𝘁𝗼 𝗵𝗲𝗹𝗽 𝗮𝗻𝘆𝗼𝗻𝗲 𝗵𝗮𝘃𝗲 𝘁𝗵𝗲 𝘄𝗶𝗹𝗹𝗶𝗻𝗴 𝘁𝗼 𝗽𝗮𝗿𝘁𝗶𝗰𝗶𝗽𝗮𝘁𝗲 𝘁𝗵𝗲 𝗱𝗮𝘁𝗮 𝗰𝗵𝗮𝗹𝗹𝗲𝗻𝗴𝗲. 𝗔𝘁 𝘁𝗵𝗶𝘀 𝘁𝗶𝗺𝗲, 𝘄𝗲 𝗽𝗿𝗲𝗽𝗮𝗿𝗲𝗱 𝗮 𝗰𝗼𝗺𝗽𝗹𝗲𝘁𝗲𝗱 𝗱𝗮𝘁𝗮 𝗺𝗼𝗱𝗲𝗹 𝗶𝗳 𝗮𝗻𝘆𝗼𝗻𝗲 𝘄𝗮𝗻𝘁𝘀 𝘁𝗼 𝗱𝗲𝘃𝗲𝗹𝗼𝗽 𝘁𝗵𝗲 𝗿𝗲𝗽𝗼𝗿𝘁 𝗯𝗮𝘀𝗲𝗱 𝗼𝗻 𝗶𝘁. 𝗣𝗹𝗲𝗮𝘀𝗲 𝗰𝗼𝗻𝘁𝗮𝗰𝘁 𝗮𝗻𝘆 𝗼𝗳 𝘂𝘀 (@FPastor @kiri00 @solarson ) 𝗯𝘆 𝗗𝗠 𝘄𝗶𝘁𝗵 𝘆𝗼𝘂𝗿 𝗲𝗺𝗮𝗶𝗹 𝗮𝗱𝗱𝗿𝗲𝘀𝘀 𝘁𝗼 𝗿𝗲𝗾𝘂𝗲𝘀𝘁 𝘁𝗵𝗲 𝗣𝗕𝗜𝗫 𝗳𝗶𝗹𝗲 𝗼𝗳 𝘁𝗵𝗲 𝗱𝗮𝘁𝗮 𝗺𝗼𝗱𝗲𝗹.
𝗠𝗲𝗮𝗻𝘁𝗶𝗺𝗲, 𝗜𝗳 𝘆𝗼𝘂 𝗵𝗮𝘃𝗲 𝗱𝗼𝗻𝗲 𝘆𝗼𝘂𝗿 𝗱𝗮𝘁𝗮 𝗺𝗼𝗱𝗲𝗹 𝗮𝗻𝗱 𝗿𝗲𝗽𝗼𝗿𝘁, 𝗽𝗹𝗲𝗮𝘀𝗲 𝗷𝘂𝘀𝘁 𝘀𝗵𝗮𝗿𝗲 𝗶𝘁 𝗶𝗻 𝗼𝘂𝗿 𝗴𝗿𝗼𝘂𝗽 𝗮𝗻𝗱 𝘀𝘂𝗯𝗺𝗶𝘁 𝘆𝗼𝘂𝗿 𝗲𝗻𝘁𝗿𝘆. 𝗜𝗳 𝘆𝗼𝘂 𝗵𝗮𝘃𝗲 𝗮𝗻𝘆 𝗳𝘂𝗿𝘁𝗵𝗲𝗿 𝗾𝘂𝗲𝘀𝘁𝗶𝗼𝗻 𝗿𝗲𝗴𝗮𝗿𝗱𝘀 𝘁𝗼 𝘁𝗵𝗶𝘀 𝗮𝗻𝗻𝗼𝘂𝗻𝗰𝗲𝗺𝗲𝗻𝘁, 𝗽𝗹𝗲𝗮𝘀𝗲 𝗰𝗼𝗺𝗺𝗲𝗻𝘁 𝗯𝗲𝗹𝗼𝘄. 𝗧𝗵𝗮𝗻𝗸𝘀.
Hi,
New to the challenge and I’d like to ask a few questions to ensure my understanding is correct.
Thanks in advance for taking the time to look into these!
KR
Jonathan
Welcome to the challenge.
I am requesting the advice of the data owner to clarify your queries. I am sure he will be back to you as soon as possible.
In the interim, please peruse previous comments in this forum, in case some of your questions are already clarified.
@MudassirAli - would you please clarify Johnny’s questions.
Thanks
Federico
You are correct that it is not necessary to compare the information of Sales Order with Finished Goods table.
Finished Goods inventory was obtained on 5th May 2022 and I believe the date in Finished Goods table is inaccurate (it should be 5/5/2022). Sales order and Finished Goods both reports were run on 5th May and these are run on a daily basis.
No need to validate the closing quantity by calculating opening plus produced minus consumption as there always are inventory adjustments during inventory cycle counts that’s why in most of the cases, the calculation is not equal to the closing quantity.
I hope this helps .
Hi @Johnny!
Welcome to challenge # 20.
Sales forecast is the budget that is set in the prior year and never changes during the year. Production forecast is also done by sales team but it changes quarterly and sometimes monthly (especially after COVID) based on different factors (loss of customers, seasonal demands, new customers etc.). You can say that Sales forecast is a long term forecast whereas production forecast is the short term forecast.
Yes, sales orders report is run on a daily basis and new sales come in every day and actual production is adjusted accordingly.
That’s again correct. All the machines have different capacities and the output also varies accroding to different products.
Let me know if you have more questions.
Thanks!
Hi @MudassirAli, thanks for the quick turnaround. Fully clear on 1 and 2. Thanks!
OK, just double checking we understand each other on the 3rd one.
I thought for example machine F-10 and F-11 should potentially be able to produce the same.
Obviously they haven’t produced exactly the same amounts over the past years, but I was wondering if I could come with insights about how efficient a machine is and compare machines.
But that is only possible if the potential is the same and I hence can compare apples with apples, meaning similar machines of the same machine type.
If the potential is different for each machine, then I guess we can’t say much on this route (something I thought of exploring). Right?
Thanks
You are correct… There are no good insights to be extracted by comparing the machines… It could have been useful if we were analyzing the bottlenecks on the machines. As for some background information, machines are made in such a way that with some minor adjustments, many products can be run on different machines if a particular machine is fully booked.
Thanks!
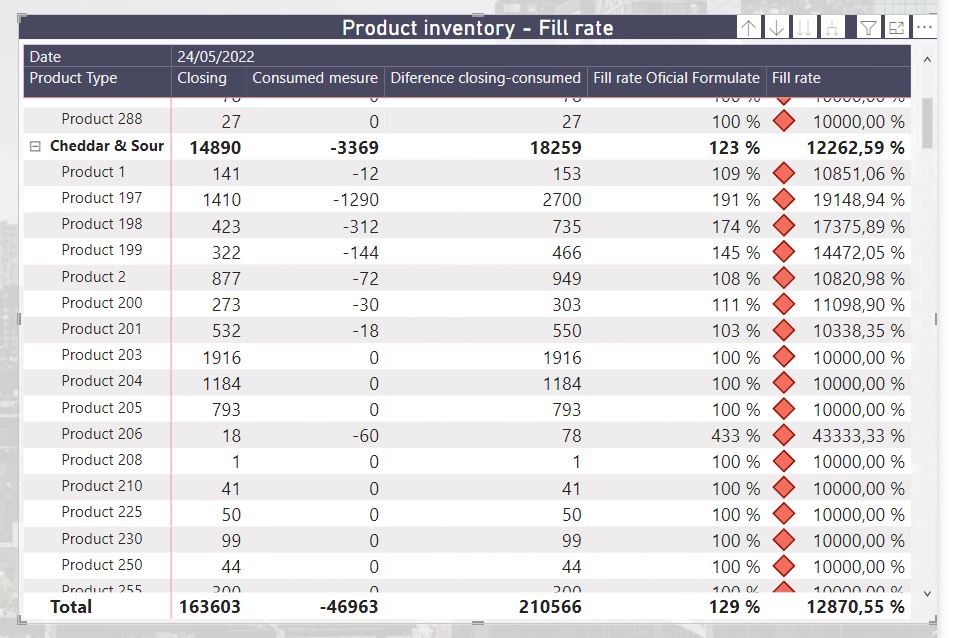
Hello group, good morning in advance greetings to all.
This is my first message I need help with challenge number 20 since in the inventory the calculation of the fill rate gives me amazing percentages since the consumed are in negative and according to the information the consumed are the sold then when generating the formula of the ratio of filling is as in the image if you could help me or give me ideas to know where I am failing it would be wonderful
Hi @VICENTEajm ,
What formula are you using to calculate the last column?
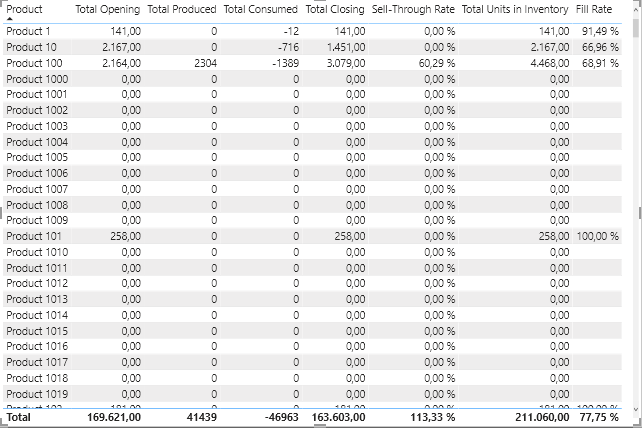
I see that in the penultimate column there is already the fill rate and it coincides with my calculations.
After reviewing the calculation I think we should multiply the Units Consumed by -1 or add them to the total number of units in the inventory since they are negative.
Fill Rate = DIVIDE( ( [Total Units in Inventory] - ( -1 * [Total Consumed] ) ), [Total Units in Inventory] )
Regards,
@jafernandezpuga and @VICENTEajm
Hehe dos de habla hispana comiendose la cabeza en Ingles.
Genial
Federico
hello jafernandezpuga thank you very much for your explanation, but in the request for questions
Thank you very much for your help.
Jajaja literal  .
.