FWIW, I have brought in additional data in almost every one of my past challenge entries, but just made sure to document that in my writeup. I do it for two reasons: 1) to best mimic what I would do in a real-life situation; and 2) to further my own learning goals for that challenge.
Keep in mind that the primary audience for your challenge entry is yourself. Try to hew to the general outline of the brief, but feel free to do what you need to do to make the exercise maximally useful for your own learning.
FYI - within the US government, the standard assumption for budgeting one FTE (full-time employee) workyear is 2080 hours.
8 hours or 7.5 hours no big difference, but keep in mind that this is for consultant not full time employee’s so one consulting contract might different from the next. As you can see in the data, different customers and different hourly rate $. Also, some gaps in the timeline. You might have some time where you don’t have work or a customer between the contracts.
So, if I would to a Utilization KPI I would and I probably calculate it on a monthly basis, not yearly. Then take all my monthly’s utilization and make a yearly Utilization KPI
Also, you will notice a gap in the data, 2020-04 to 2020-08 that’s when COVID-19 hit our part of the world and everything was shut down.
@Sabine, @ericet , @KimC
The en-US version of Microsoft Project provide a Standard Base Calendar that reflects a traditional work schedule in US as Monday through Friday, 8:00 A.M. to 5:00 P.M., with an hour off for break that is an availability 08 hours per working day
and you can find the 10 days US Federal Holidays here US Holidays 2020 (us-public-holidays.com)
This is how you can get the 2000 working hours mentioned in the resource provided in the brief
For those who want to add a Quebec public holiday table to the Dates table provided to aid in the calculation of utilization rates, I’ve done so by iterating on the following website for 2018-2020, and then sending the results out to CSV via DAX Studio.
If you don’t want to go through the minor headache of doing this, I’ve attached my CSV file below. Note that when you pull the attached file in via Get Data, you’ll just need to strip off the time string and change the Holiday Date field from text to date type.
Good luck with your entries! I’m really enjoying this one…
I decided to add another column (Hours per Day) to the numbers-export-atwork.csv dataset.
This will permit me to add the Hours per Day to the data
not all contract have the same hours per day value.
In this dataset the values range is: 7, 7.5, 8 hours per day.
With this value, I will now be able to calculate my Utilization KPI
Utilization = (Billable Hours / Total Hours) x 100 %
I accepted the challenge and sharing the image of my report…
I have exposure to sales related data only. This resource utilization helped me to learn many things especially understanding the data first. I went through many articles on this for basic understanding and then decided what are all things a user may wish to view in the dashboard.
I am participating for the first time. I need your input to fine tune
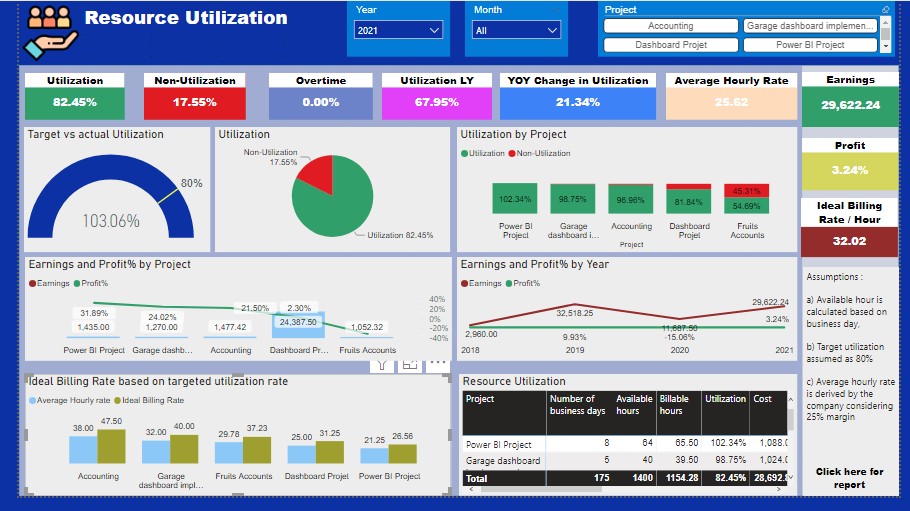
I like it, fun to see other ideas. I don’t understand the profit. It’s a timesheet with yes $ values for the hour * by hourly rate which give the total billed revenue for a month example not profit.
I assumed that the average hourly rate is derived considering a minimum of 25% profit. When the utlization rate goes down, it will impact our profit. Considering that, I have included how much we are getting.
My point of view is that this dashboard is not made for Profit tracking it’s mainly to track a consultants hours at a customer with the related revenue generated by the consultants hours that he has done.
Also for the utilization KPI is to give an indication of how many potential hours their is and how many hours he did work out of the potential hours he could have done.
The error is just one of the customers-client had 7 hour per day instead of 7.5 per day so I realized it the total for that customer was not what I expected. But if your using my file where I added a field then just reload it if you did not use my file then it’s Ok
I added a field to be able to calculate the utilization KPI.
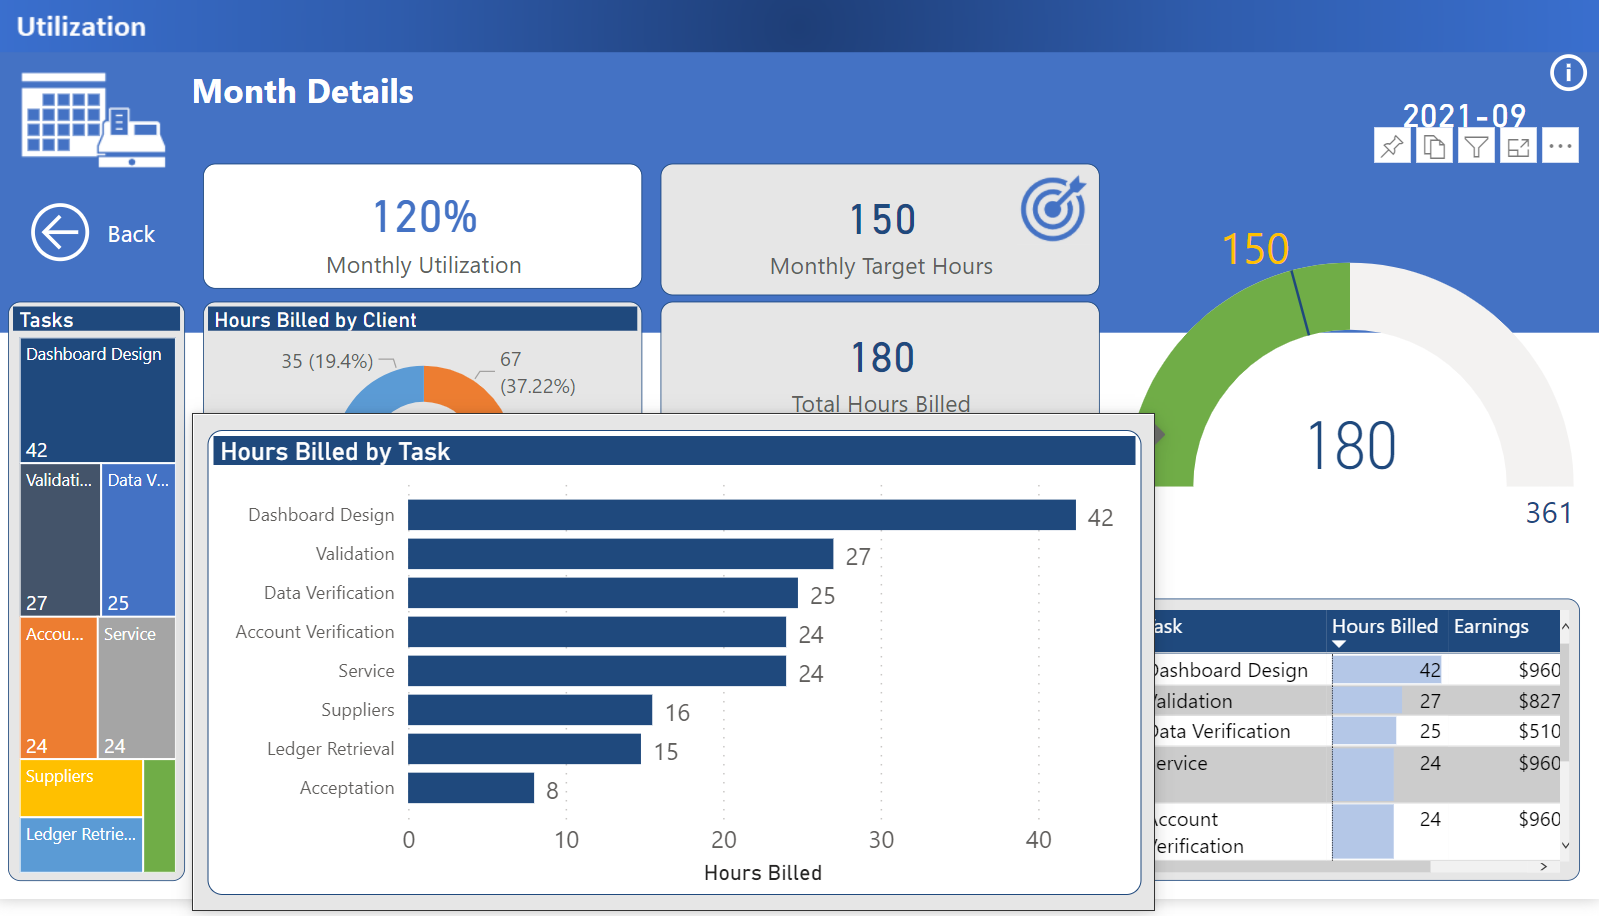
I have a question for the experts, something that is bugging me for my report. When I start the sorting is good, when I do a drill down I don’t like the sort. I’m drilling down from year to month, year is Ok but when I drill down to months, the months are not in chronological order… and that bugs me.
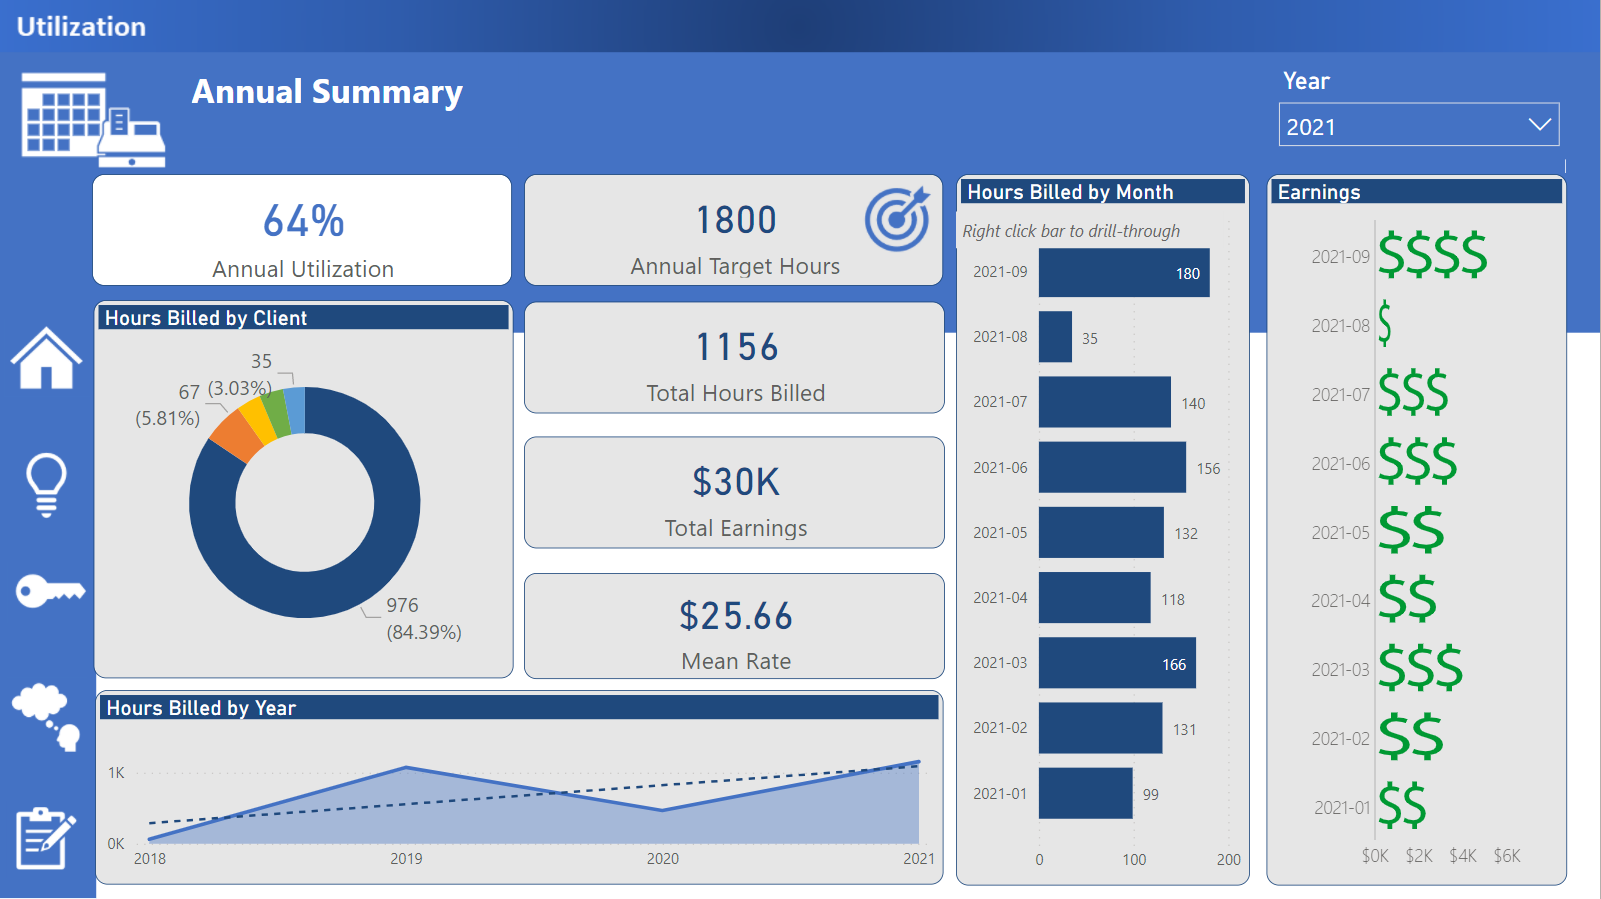
What a fun project! I focused on utilization and I took a simple approach to the utilization target.
50 weeks in a year, allowing for two weeks of vacation and holidays. 40 hours per week gives 2000 hours per year. I took 90% to allow for administration, training, and sales activities. So, the utilization target is 1800 hours per year.
I cleaned up the data a bit and removed duplicates in the model.