Hey,
The report is to display the Cases by Top 3 Products (%) for a Firm in ‘Banking Service’ industry or ‘Investment’ industry vs. all firms in that same industry. I would like to need your help to check why the Industry’s top 3 products are not always displaying correctly. I have attached a power bi test case where more details are available.
- Entity Relationship Diagram:
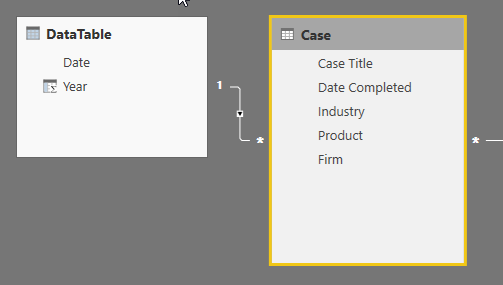 ,
,
-
DAX Calculations:
FIRM_Total of Case = calculate(
DISTINCTCOUNT(‘Case’[Case Title]), filter (‘Case’, ‘Case’[Date Completed]<>blank()
))Firm_Total of Case AllProd =
Calculate( [FIRM_Total of Case], all(‘Case’[Product]))FIRM (TOP 3 Product%) = divide (
[FIRM_Total of Case],
[Firm_Total of Case AllProd]
)RankProductFirm = if([FIRM (TOP 3 Product%)]<>blank(),
(Rankx( ALLselected(‘Case’[Product]), ‘Key Measurements’[FIRM (TOP 3 Product%)], ,DESC)), 4)Sector (Closed)_RevProd =
VAR SECTOR=
CALCULATETABLE( VALUES(‘Case’[Industry]),
ALL(‘DataTable’),
aLL(‘Case’[Product])
)RETURN
Calculate ([FIRM_Total of Case], All(‘Case’[Firm]), SECTOR)SECTOR_AllProd =
Var Sector=
Calculatetable (Values(‘Case’[Industry]),
All(‘DataTable’)
)
Return
Calculate ([FIRM_Total of Case], All(‘Case’[Firm],‘Case’[Product]), sector)SECTOR (Top 3 Product%) = DIVIDE
([Sector (Closed)_RevProd],[SECTOR_AllProd] )
RankProductSector = if([SECTOR (Top 3 Product%)]<>0,
(Rankx( ALL(‘Case’[Product]), ‘Key Measurements’[SECTOR (Top 3 Product%)], ,DESC)), 4)
TopProduct =
min(
[RankProductFirm], [RankProductSector]
)
-
Matrix Report Top 3 Product(%) for the firm vs. all firms in the same industry:
I have below two examples to display the report.
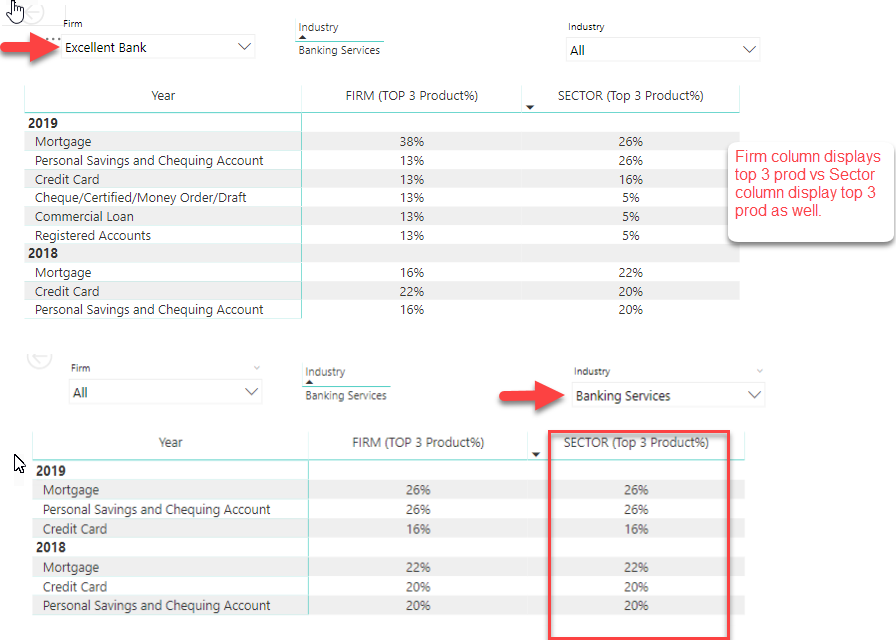
3.1 The 'Excellent Bank’
the firm’s top 3 and the Industry’s top 3 are all display correctly.
3.2 Best Bank
But the ‘Best Bank’ - the industry’s top 3 seems not correct.
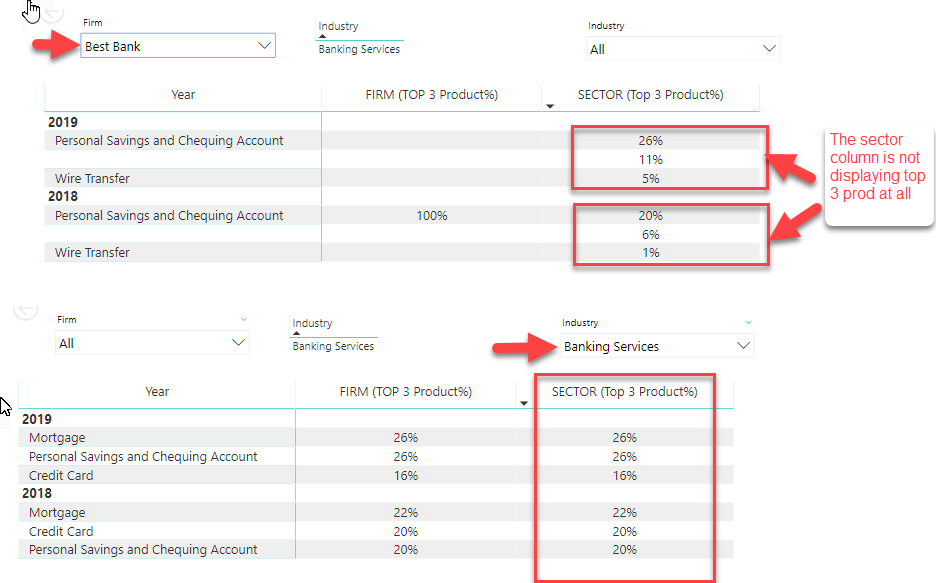
4**. Questions:** I am wondering why the Best Bank is not display top 3 prod correctly? How to fix? I am attaching the Power BI reports for more details.