Carriage returns from Sharepoint List

I have a Sharepoint list and I am using a multiline text (plain text) field for as a list or resource. Show in sharepoint as :

John Smith
Bob Williams
Brad Newlands

The question is how do I get a blank line or carriage return to separate the entries in Power BI all I get is

John SmithBob WilliamsBrad Newlands

@radley,

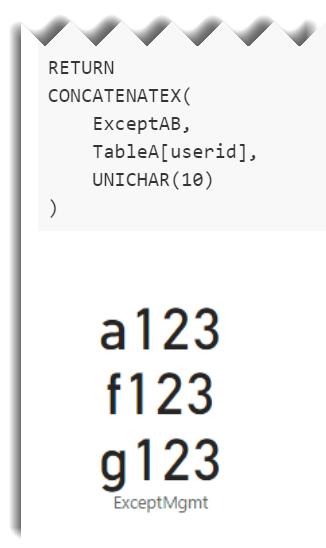
Try using unichar(10) as your delimiter, and make sure you have the word wrap option turned on.

Here’s a recent post where I used that trick in a card visual to return multiple lines of text:

Hope this is helpful.

  • Brian

Hi @radley, we’ve noticed that no response has been received from you since the 14th of April. We just want to check if you still need further help with this post? In case there won’t be any activity on it in the next few days, we’ll be tagging this post as Solved. If you have a follow question or concern related to this topic, please remove the Solution tag first by clicking the three dots beside Reply and then untick the checkbox. Thanks!

@BrianJ Still not getting this sorted.

The first image is how PBI shows field from SharePoint
The Second Image is the data in Sharepoint
The third is the Column values in Sharepoint

PowerBi SharePoint

@radley,

Sorry- I completely misinterpreted your initial question. Have you tried the import techniques discussed here?:
https://community.powerbi.com/t5/Service/Power-BI-Get-Data-From-SharePoint-List-Library/td-p/280109

  • Brian

@radley,

Another solution is if they all come in consistently like this, to just process them as is in Power Query:

First, split column by lowercase to uppercase :

image

Then just select the name columns and unpivot:

image

Now it’s an easy matter to delete the attribute column, and then if desired split the name column into first and last name using the Split by Delimiter option choosing Space:

image

I hope this is helpful.

  • Brian

Hi @BrianJ

Thanks for your help looks like we are getting there but my data not quite accurate Should be

Project 1 has the following resources
John Smith
Bob Williams
Brad Newlands

Project 2 has
John Smith
Bob Williams
Jane Wild

The Split column is working and then with the unpivot gives me

Project 1 John Smith
Project 1 Bob Williams
Project 1 Brad Newlands
Project 2 John Smith
Project 2 Bob Williams
Project 2 Jane Wild

What I need to get is
Project 1 John Smith
Bob Williams
Brad Newlands
Project 2 John Smith
Bob Williams
Jane Wild

@radley,

This is doable, but a little trickier than it seems at first glance. Here’s what I did, starting with your unpivoted data above :

  1. pulled the whole string into one column called Project And Name

  2. duplicated the column, and split by character transition (digit to text) to get two columns: Project Only and Name Only

  3. Grouped Rows by Project Only and All Rows

  4. this is where it gets a little tricky - went into advanced editor and added the following line to the M code:

    {“First in List”, each List.First( [Name Only] ), type text}

In the Grouped Rows section of the code. This gives us the first name in each project

  1. expanded all rows
  2. created a conditional column called Final:

And we’re done…

image

Full solution file attached below, and here’s the full M code

let
    Source = Table.FromRows(Json.Document(Binary.Decompress(Binary.FromText("i45WCijKz0pNLlEwVPDKz8hTCM7NLMlQUIrVQZZxyk9SCM/MyclMzC3GkCtKTFHwSy3PScxLQZM0QjISTQK3iUBNiXmpIMkUpdhYAA==", BinaryEncoding.Base64), Compression.Deflate)), let _t = ((type text) meta [Serialized.Text = true]) in type table [#"Project and Name" = _t]),
    #"Changed Type" = Table.TransformColumnTypes(Source,{{"Project and Name", type text}}),
    #"Duplicated Column" = Table.DuplicateColumn(#"Changed Type", "Project and Name", "Project and Name - Copy"),
    #"Renamed Columns" = Table.RenameColumns(#"Duplicated Column",{{"Project and Name - Copy", "Name Only"}}),
    #"Split Column by Character Transition" = Table.SplitColumn(#"Renamed Columns", "Name Only", Splitter.SplitTextByCharacterTransition({"0".."9"}, (c) => not List.Contains({"0".."9"}, c)), {"Name Only.1", "Name Only.2"}),
    #"Renamed Columns1" = Table.RenameColumns(#"Split Column by Character Transition",{{"Name Only.1", "Project Only"}, {"Name Only.2", "Name Only"}}),
    #"Grouped Rows" = Table.Group(#"Renamed Columns1", {"Project Only"}, {{"Ct", each Table.RowCount(_), type number}, {"AllRows", each _, type table [Project and Name=text, Project Only=text, Name Only=text]},
     {"First in List", each List.First( [Name Only] ), type text}}),
    #"Expanded AllRows" = Table.ExpandTableColumn(#"Grouped Rows", "AllRows", {"Project and Name", "Project Only", "Name Only"}, {"AllRows.Project and Name", "AllRows.Project Only", "AllRows.Name Only"}),
    #"Added Conditional Column" = Table.AddColumn(#"Expanded AllRows", "Final", each if [AllRows.Name Only] = [First in List] then [AllRows.Project and Name] else [AllRows.Name Only])
in
    #"Added Conditional Column"

Hope this gets you what you need.

Hi @radley, we’ve noticed that no response has been received from you since the 17th of April. We just want to check if you still need further help with this post? In case there won’t be any activity on it in the next few days, we’ll be tagging this post as Solved. If you have a follow question or concern related to this topic, please remove the Solution tag first by clicking the three dots beside Reply and then untick the checkbox. Thanks!

@BrianJ Sorry for al the backways and forward really appreciate your help.

I have attached what I am looking for
1Project Data Source is how Sharepoint is sending through the data.

2Project Data Result is what I am looking for so the information can be displayed as per the visual below

End result visual

Hope you can help

Cheers
Radley

eDNA Forum - Process Name List Solution.pbix (58.2 KB)

@radley,

Okay, thanks very much for the clear explanation of the requirement with example. Here’s the outcome, with your desired format on the left and my solution on the right:

Here’s what I did:

  1. Split the SharePoint list by lowercase to uppercase

  2. Unpivoted the resulting names column

  3. Added an index column (to maintain the name order in the following measure)

  4. Use the CONCATENATEX, UNICHAR(10) trick discussed above in the following measure, to concatenate all the names on a given project with a hard return between them, ordered by the ascending index order:

    CONCATX Name =

     CONCATENATEX(
         'Sharepoint Transformed',
         'Sharepoint Transformed'[Name],
         UNICHAR(10),
         'Sharepoint Transformed'[Index],
         ASC
     )
    

Then just dropped project and the measure into the table visual. Hopefully, the third times a charm on this one…

Full solution file posted below.

Hi @radley, a response on this post has been tagged as “Solution”. If you have a follow question or concern related to this topic, please remove the Solution tag first by clicking the three dots beside Reply and then untick the check box. Thanks!