Can DAX evaluate an inventory report FIFO?

Hello experts,

Need your help on one of my task which I really have no idea how to do it.
It is about a stock aging which I need to group it by certain bucket group, but the main issue is I need to track down when it has stock out (minus qty) it should substract the older qty first which maybe not in the same month (that is if my grouping is by monthly)

The explanation is like this:
For example I have this data :
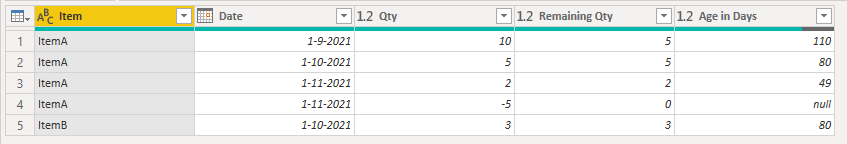
Item Date Qty
ItemA 9/1/2021 10
ItemA 10/1/2021 5
ItemA 11/1/2021 2
ItemA 11/1/2021 -5
ItemB 10/1/2021 3

with this kind of grouping for the stock aging bucket:

Age from to
1 month 0 30
2 month 31 60
> 2 month 61 9999

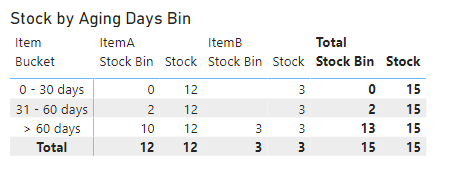
I want to have the matrix of my stock aging to be like this :

Available 1 month 2 month > 2 month
ItemA 12 2 5 5
ItemB 3 0 3 0

ItemB is very simple because it has only 1 value and it has no stock out. but ItemA, there is a special treatment whereby the stock out -3 should substract the qty of the beginning available qty, so because the beginning has a purchase (stock in) of 10, 2 months before, it will need to substract this value.

This is what we usually called it FIFO / First In First Out.

Iā€™ve done some basic like Samā€™s did with the classification but it will give me the wrong one like this :

Available 1 month 2 month > 2 month
ItemA 12 -3 5 10
ItemB 3 0 3 0

How to have the 1st matrix ? Can DAX support this kind of calculation ?
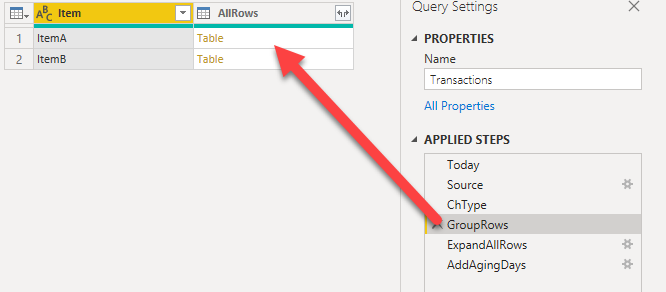
I attached the sample PBIX for your convenience.
StockAging.pbix (19.2 KB)

It would be much appreciated if you guys can help me out on this.

Thanks

Bumping this post for more visibility.

Hi @Toni,

Give this a go.
Iā€™ve added a Dates and Items table and 2 helper columns to Transactions in Power Query

let
    Today = Date.From( DateTime.FixedLocalNow()),
    Source = Table.FromRows(Json.Document(Binary.Decompress(Binary.FromText("i45W8ixJzXVU0lGy1DfUNzIwMgQyDQ2UYnUQMoYGCClTVBlDhIwRThldhCYnNOOMlWJjAQ==", BinaryEncoding.Base64), Compression.Deflate)), let _t = ((type nullable text) meta [Serialized.Text = true]) in type table [Item = _t, Date = _t, Qty = _t]),
    ChType = Table.TransformColumnTypes(Source,{{"Item", type text}, {"Date", type date}, {"Qty", Int64.Type}}),
    GroupRows = Table.Group(ChType, {"Item"}, {{"AllRows", each 
        let
            AddIndex = Table.AddIndexColumn( _, "Index", 1, 1, Int64.Type),
            AddRemQty = Table.AddColumn( AddIndex, "Remaining", each 
                let 
                    lQty = List.Buffer(AddIndex[Qty]), 
                    calc = List.Sum( {0} & List.Select( lQty, each _ < 0 )) + List.Sum( List.FirstN( List.Transform( lQty, each if _ < 0 then 0 else _ ),[Index] )) 
                in 
                    if ( [Qty] < 0 or calc < 0 ) then 0 else if calc >= [Qty] then [Qty] else [Qty] - calc )
        in
            AddRemQty, type table [Item=nullable text, Date=nullable date, Qty=nullable number, Remaining=nullable number]}}),
    ExpandAllRows = Table.ExpandTableColumn(GroupRows, "AllRows", {"Date", "Qty", "Remaining"}, {"Date", "Qty", "Remaining Qty"}),
    AddAgingDays = Table.AddColumn(ExpandAllRows, "Age in Days", each if [Remaining Qty] <> 0 then Number.From( Today - [Date] ) else null, type number)
in
    AddAgingDays

.
Your table now looks like this

Marked the Dates table as a Date table.
Built a Star schema model

Added some measures for Stock and Aging.

Stock = 
    CALCULATE(
        SUM( Transactions[Remaining Qty] ),
        ALLEXCEPT( Transactions, Items[Item] )
    )

Stock Bin = 
CALCULATE(
   SUM( Transactions[Remaining Qty] ),
    FILTER(
        VALUES( Transactions[Age in Days] ),
            COUNTROWS(
                FILTER( Bucket,
                    Transactions[Age in Days] >= Bucket[From] &&
                    Transactions[Age in Days] < Bucket[To]
                )
            ) >0
    )
)

.
With this result (note there is no stock in bin 1 as age has been calculated from Dec 20th)
image

Hereā€™s your sample
StockAging.pbix (66.0 KB)

I hope this is helpful

5 Likes

Hi @Melissa

This is very cool technique, which I never know before. Iā€™m having a hard time to understand this M Language actually, like how it works.

But I have try it in my original report, and it works as well. There is one thing I want to really understand it, about the ExplandTableColumns that youā€™re using, what is the explanation of this ?

Iā€™ve looked at Microsoft docs ā†’ https://docs.microsoft.com/en-us/powerquery-m/table-expandtablecolumn but I still donā€™t understand whatā€™s their meaning.

Thanks in advance,

1 Like

Hi @Toni,

Kudos for examening the DOCS :+1:

The expand step is required to bring back the data from the nested table(s), you can view these ā€˜nested tablesā€™ when you use the Applied Steps pane to select the ā€œGroupRowsā€ step. Like below:

image

Clicking off to the side in the ā€˜white spaceā€™ indicated by the arrow head, you can view the contents of the ā€˜nested tableā€™ down below in an additional preview section (not depicted).

When you Select the next step in the Applied Steps pane (ExpandAllRows), it shows that the data from the ā€˜nested tableā€™ has been extracted and is once again present in this table view.

I hope this is helpful.

2 Likes

Hi @Melissa ,

Would this steps forced me change mode from Direct Query to Import mode ?
Sorry for late reply, I just managed to continue this, but after applying this, it is instructed me to change to Import.

Is there any workaround to make it working but still in Direct Query then ?

Thanks

Hi @Toni,

No I believe youā€™ll have to switch to import modeā€¦ Transferring the logic to a Calculated Column might not be possible either:

ā€œDAX functions, that are allowed, are limited to those functions that can be pushed to the underlying source. The functions vary depending upon the exact capabilities of the source.ā€

Read more on Direct Query limitations here:

I hope this is helpful

Hi @Melissa

Yup, noted that. However it is so unfortunate that I have to keep using Direct Query for my implementation since it is the limitation as well for my ERP usage. It is Dynamics 365 F&O, and itā€™s a must use of ā€œpureā€ Direct Query.

However this is will be my starting point to learn more on how to make it the same outcome.

Thanks very much.

Hello @Melissa,

I have an almost identical problem as Toni, however, when implementing your solution it APPEARS to be working on a surface level when in fact the calculation seems to be a little off.

For example, swapping in my sample data into your pbix provided, the Remaining Qty appears to be keeping the most recent stock (which is desireable) however, it doesnā€™t seem to be decreasing as much as it should. When aggregating both the Qty and Remaining Qty columns, the Remaining Qty value is significantly larger than Qty, when I would expect them to be the same.
image

I was really hoping this would work for me, and I feel itā€™s so close but I canā€™t figure out whatā€™s gone wrong! Again, all Iā€™ve done is drop in some sample data instead of Toniā€™s sample data, and it seems to not be working.

Many thanks for responding to an old post! File attached.
StockAging.pbix (74.1 KB)

Hi @cbchow,
This topic is closed, please create a new thread.
Thank you!